
Company Comparison Excel Tools – A worked example

We have updated our Tobacco Transformation Index Company Comparison Excel Tools to provide a broader view of an Index Company’s position relative to its peers. In this blog post, we use Imperial Brands to illustrate how a company might use our Excel Tools to analyse its 2022 Tobacco Transformation Index results and evaluate the most feasible opportunities for score and ranking improvement.
Although Imperial’s overall ranking was unchanged at fifth, it recorded the most significant score decline in the Index.
Final Score Change
Source: Tobacco Transformation Index
Its Final Score of 2.47 was only 0.07 higher than sixth-ranked
Japan Tobacco, but 0.87 lower than fourth-ranked BAT.
Final Score Scores differences with Imperial Brands Plc (2.47)
Source: Tobacco Transformation Index, Idwala Research
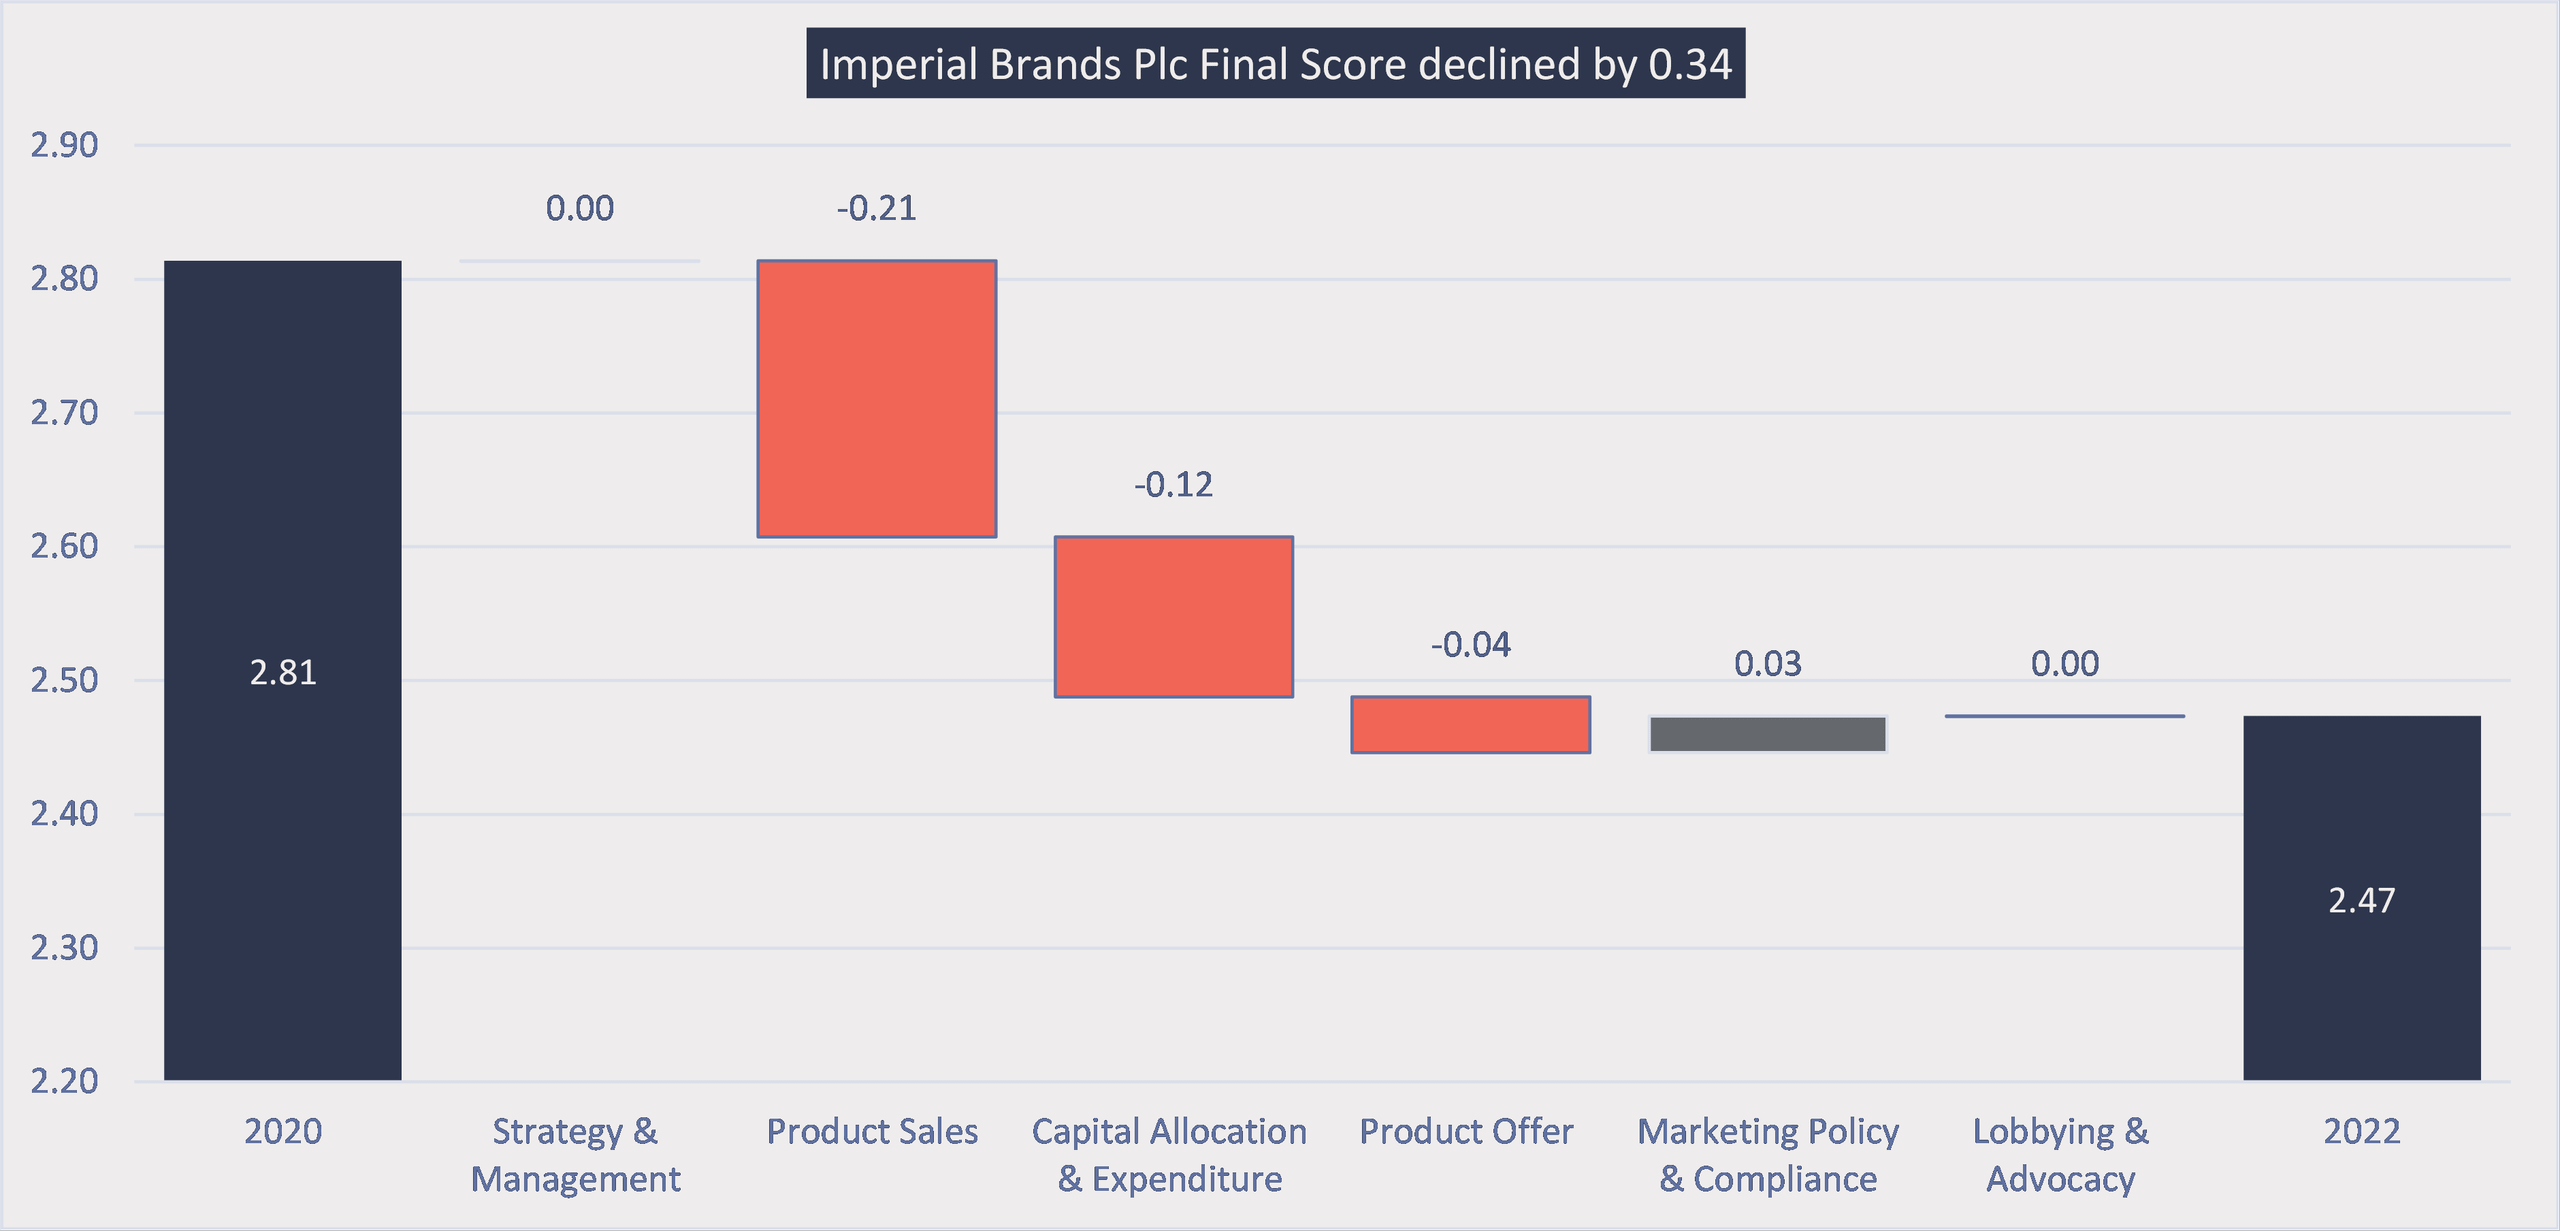
The most significant category contributors to Imperial’s
score decline were Product Sales and Capital Allocation and Expenditure.
Category contribution to Imperial Brands Plc Final Score change
Source: Tobacco Transformation Index, Idwala Research
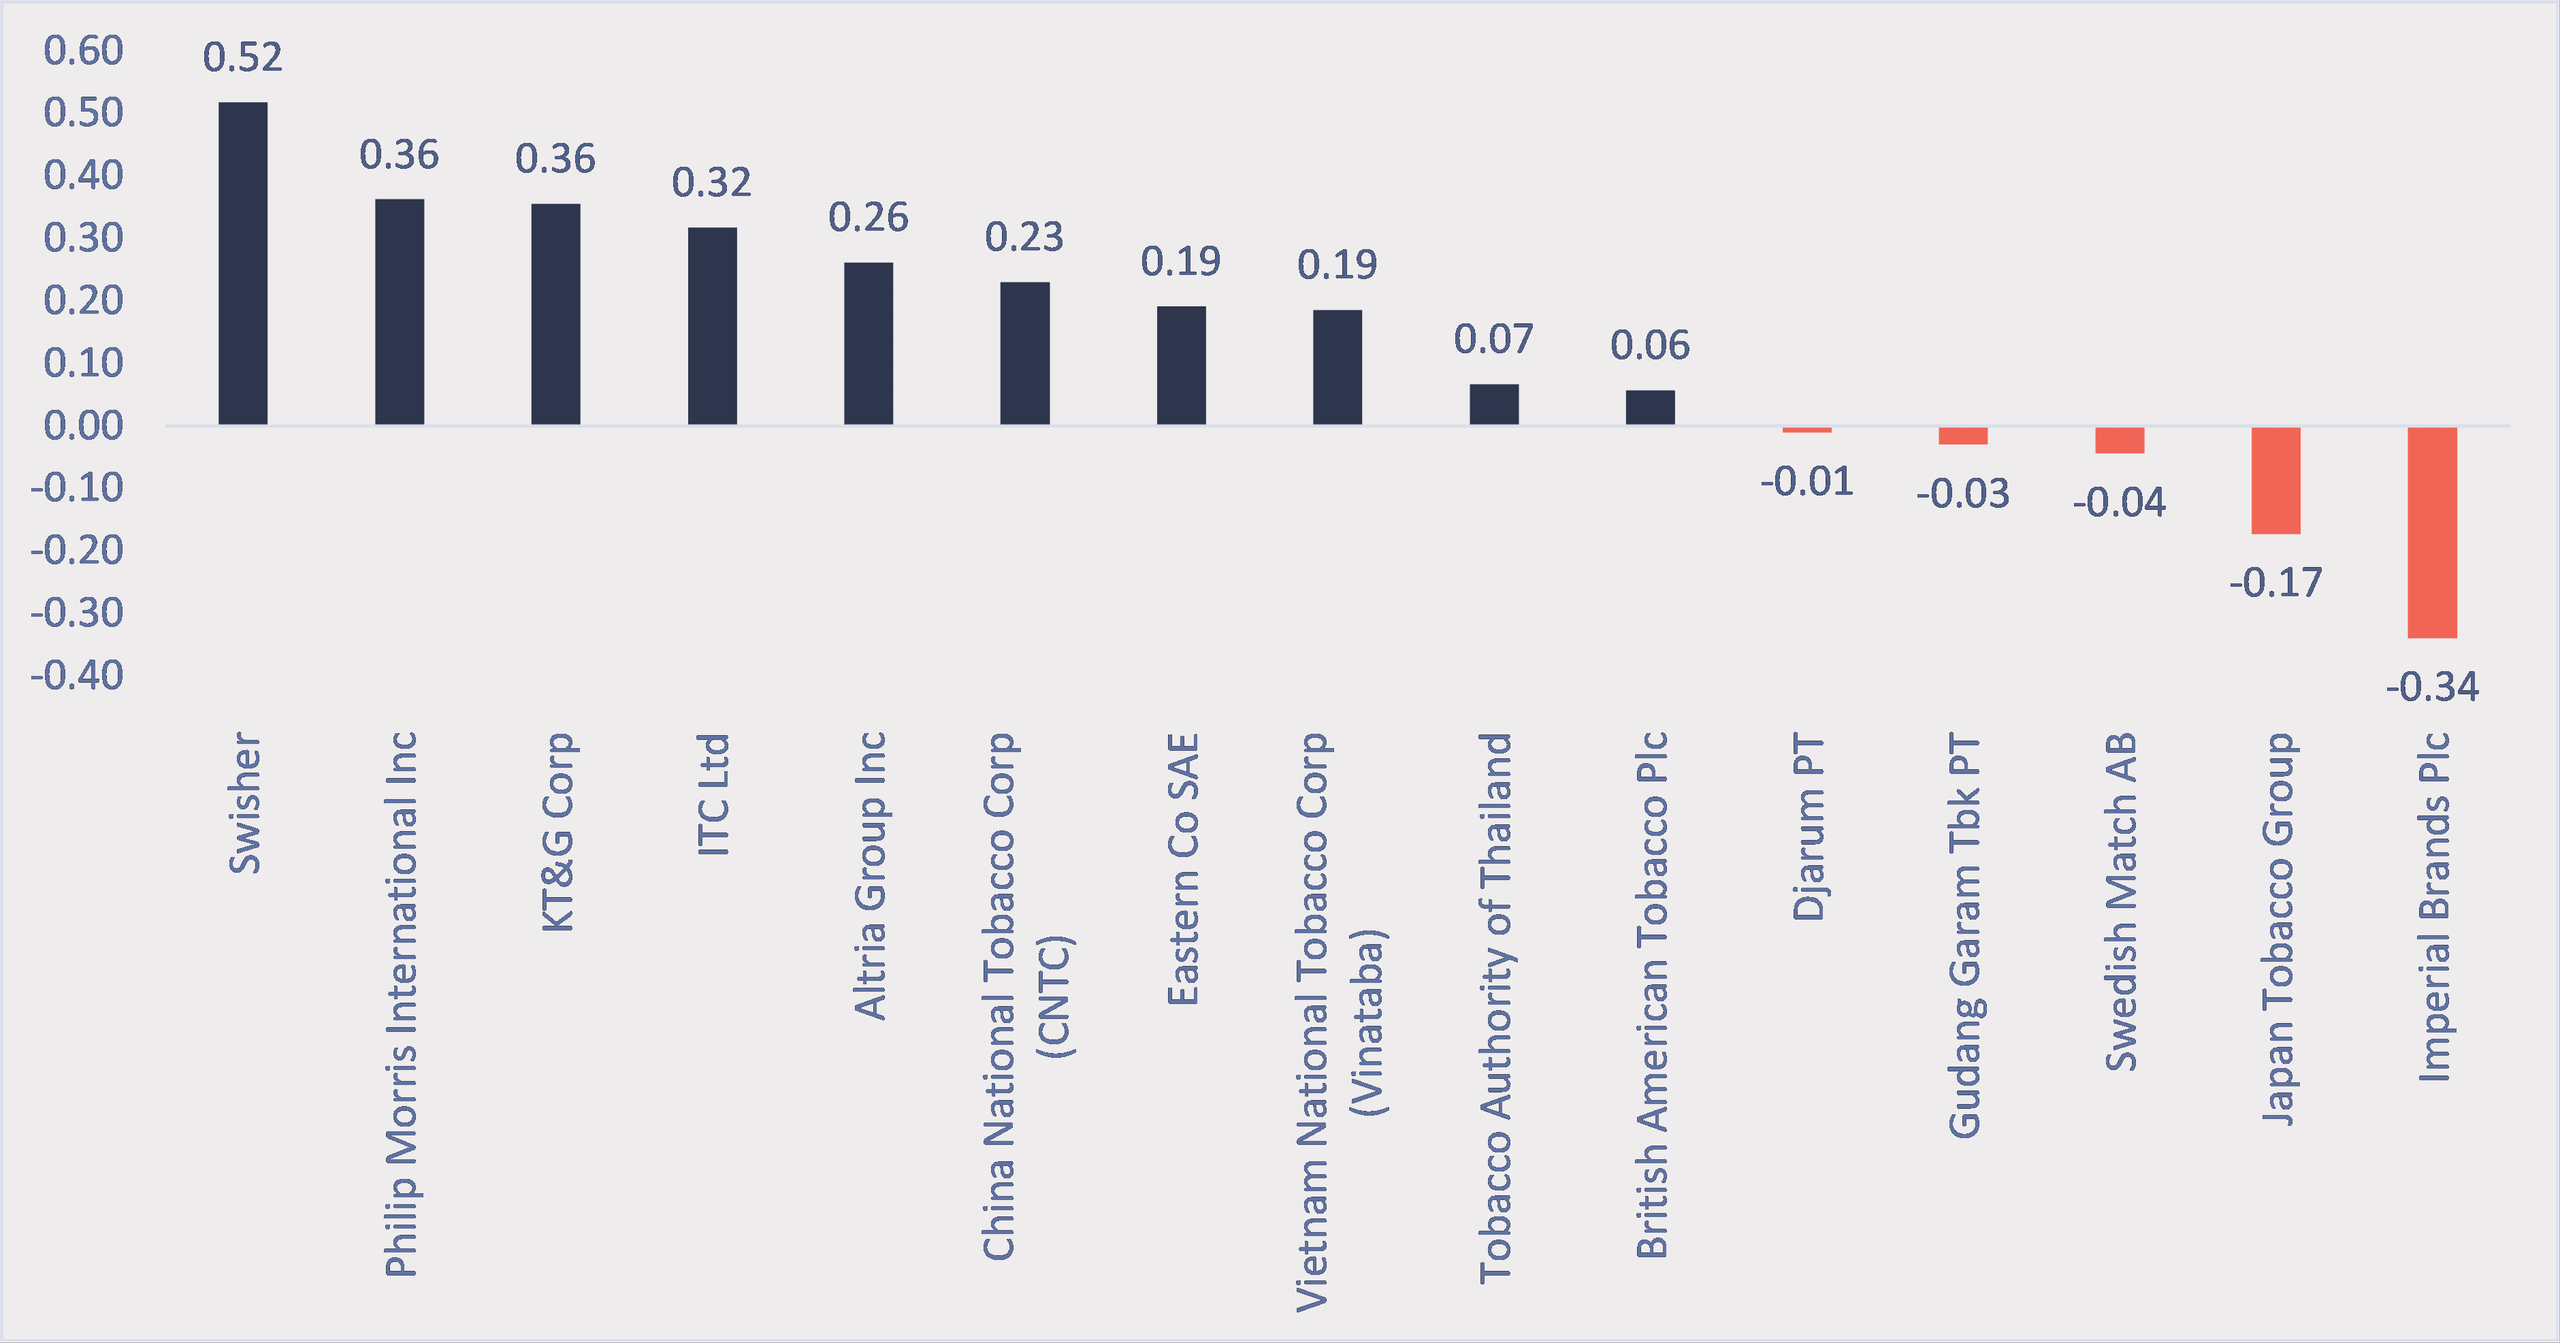
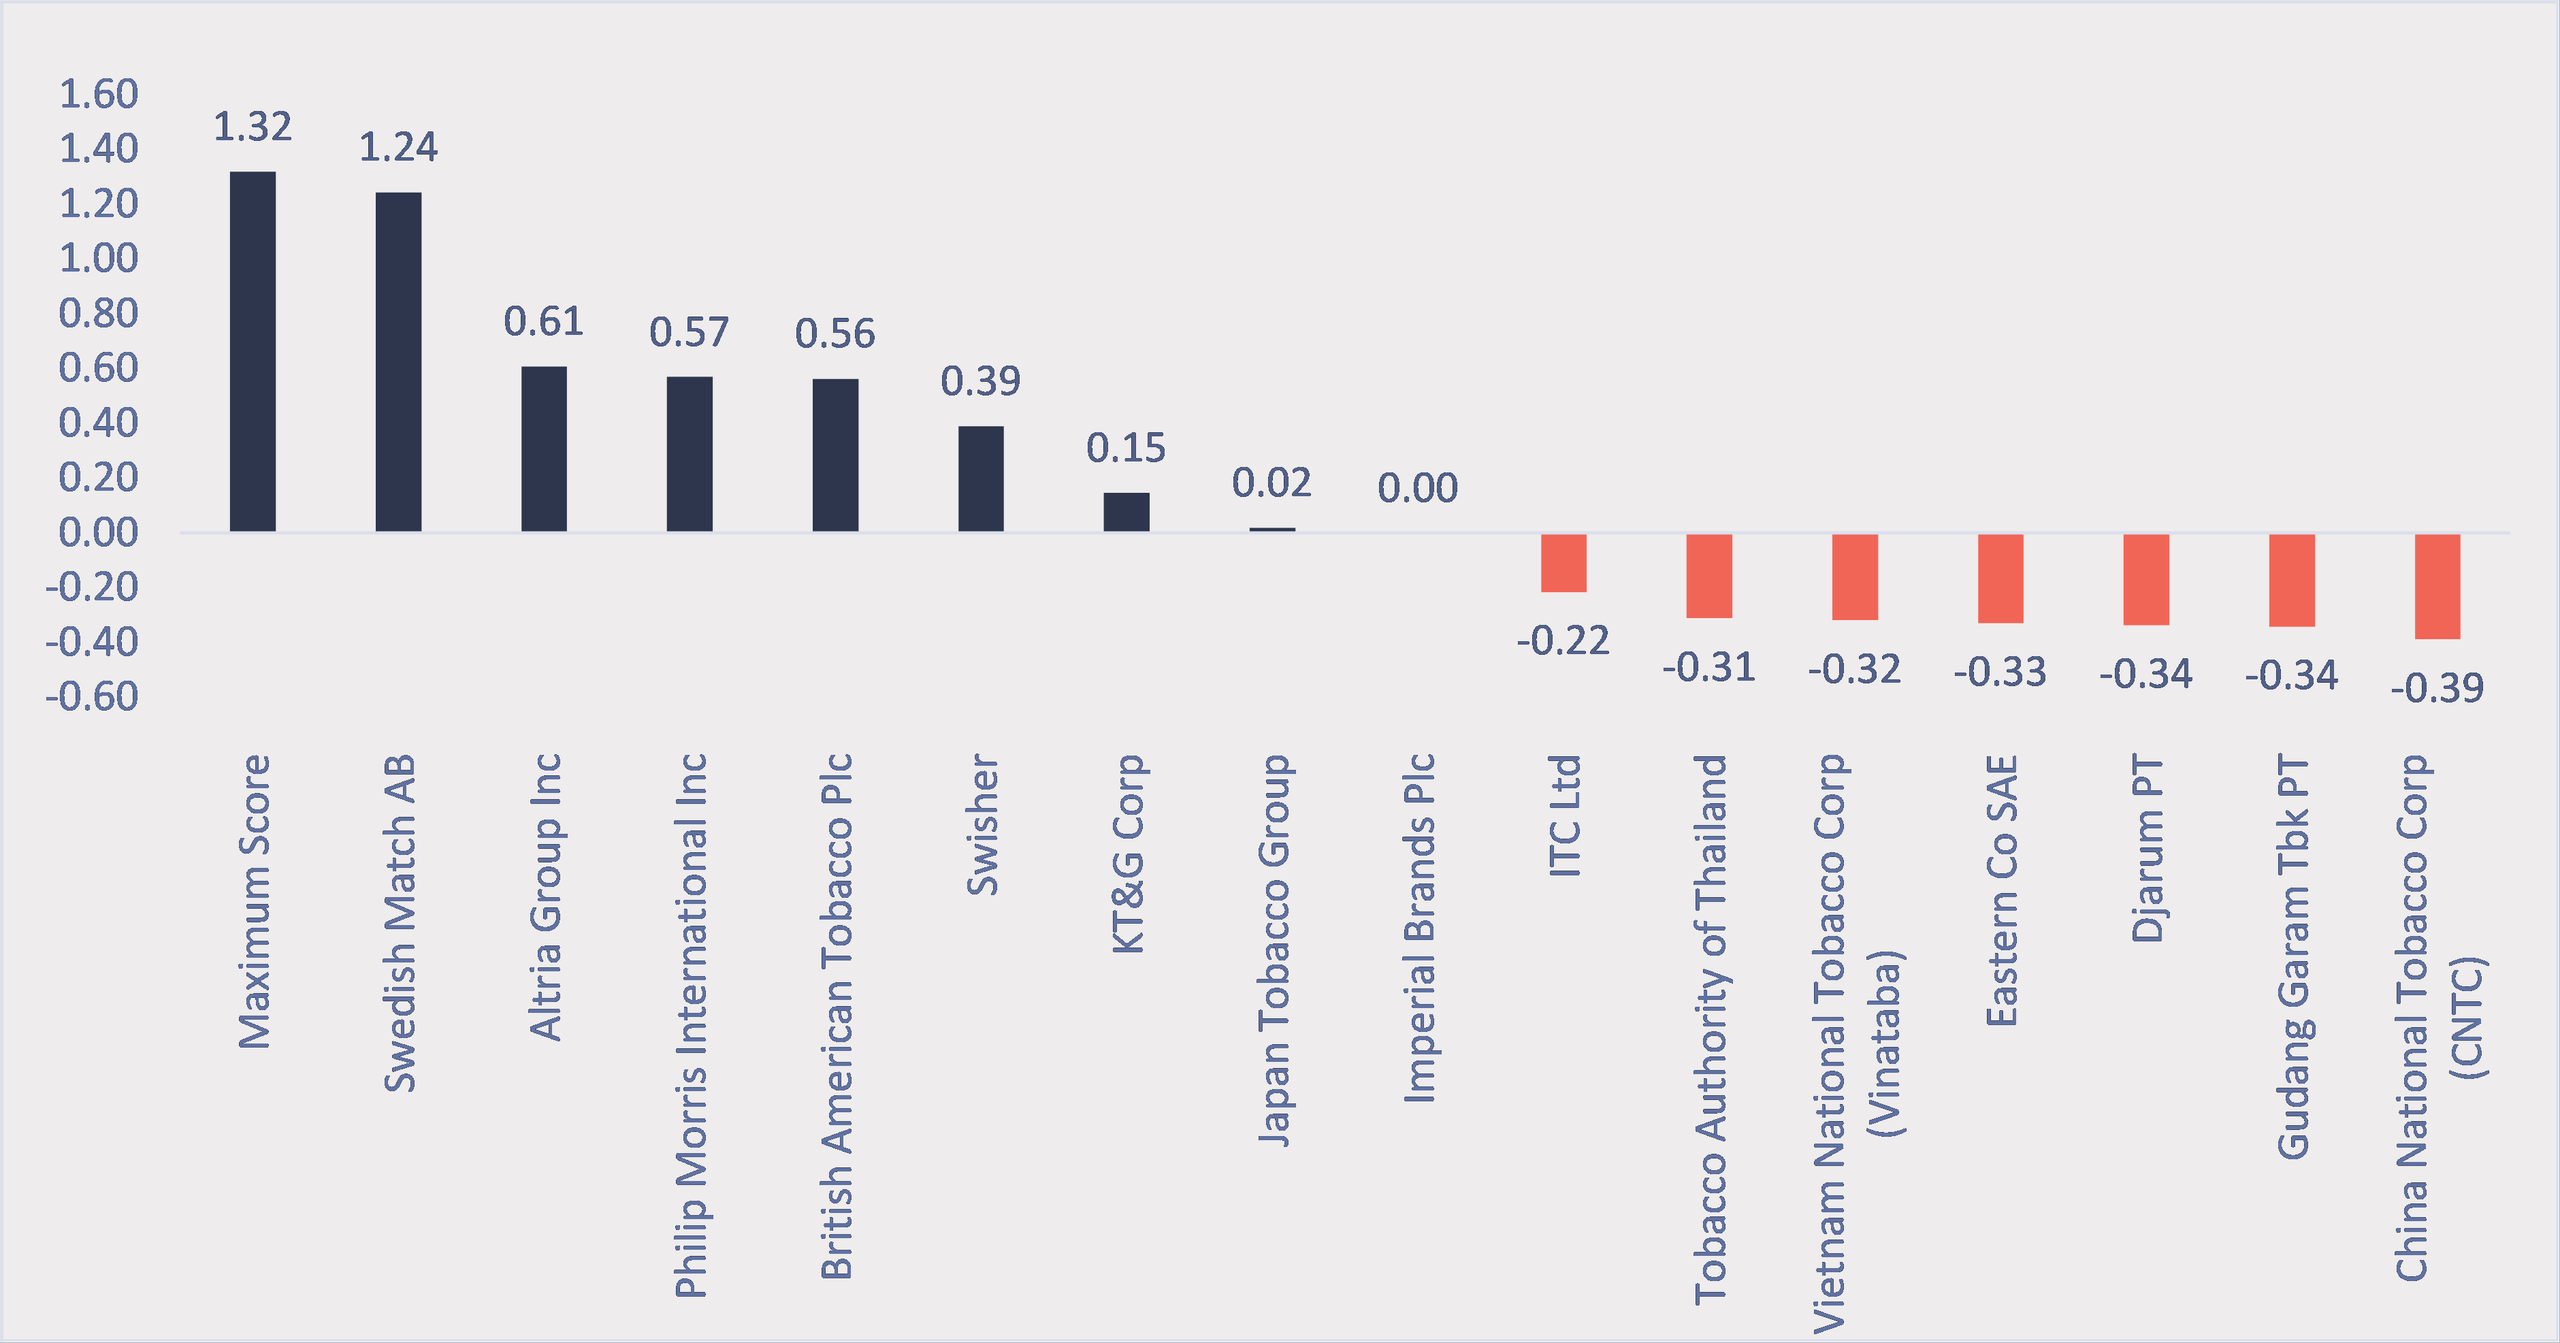
In Product Sales, Imperial also recorded the most
significant score decline (-0.21). The chart below shows the difference between
Imperial’s Product Sales Score change and those of its peers, e.g. Japan
Tobacco’s score decline was 0.04 less than Imperial’s and KT&G’s 0.13.
Product Sales Score changes relative to Imperial Brands Plc (-0.21)
Source: Tobacco Transformation Index, Idwala Research
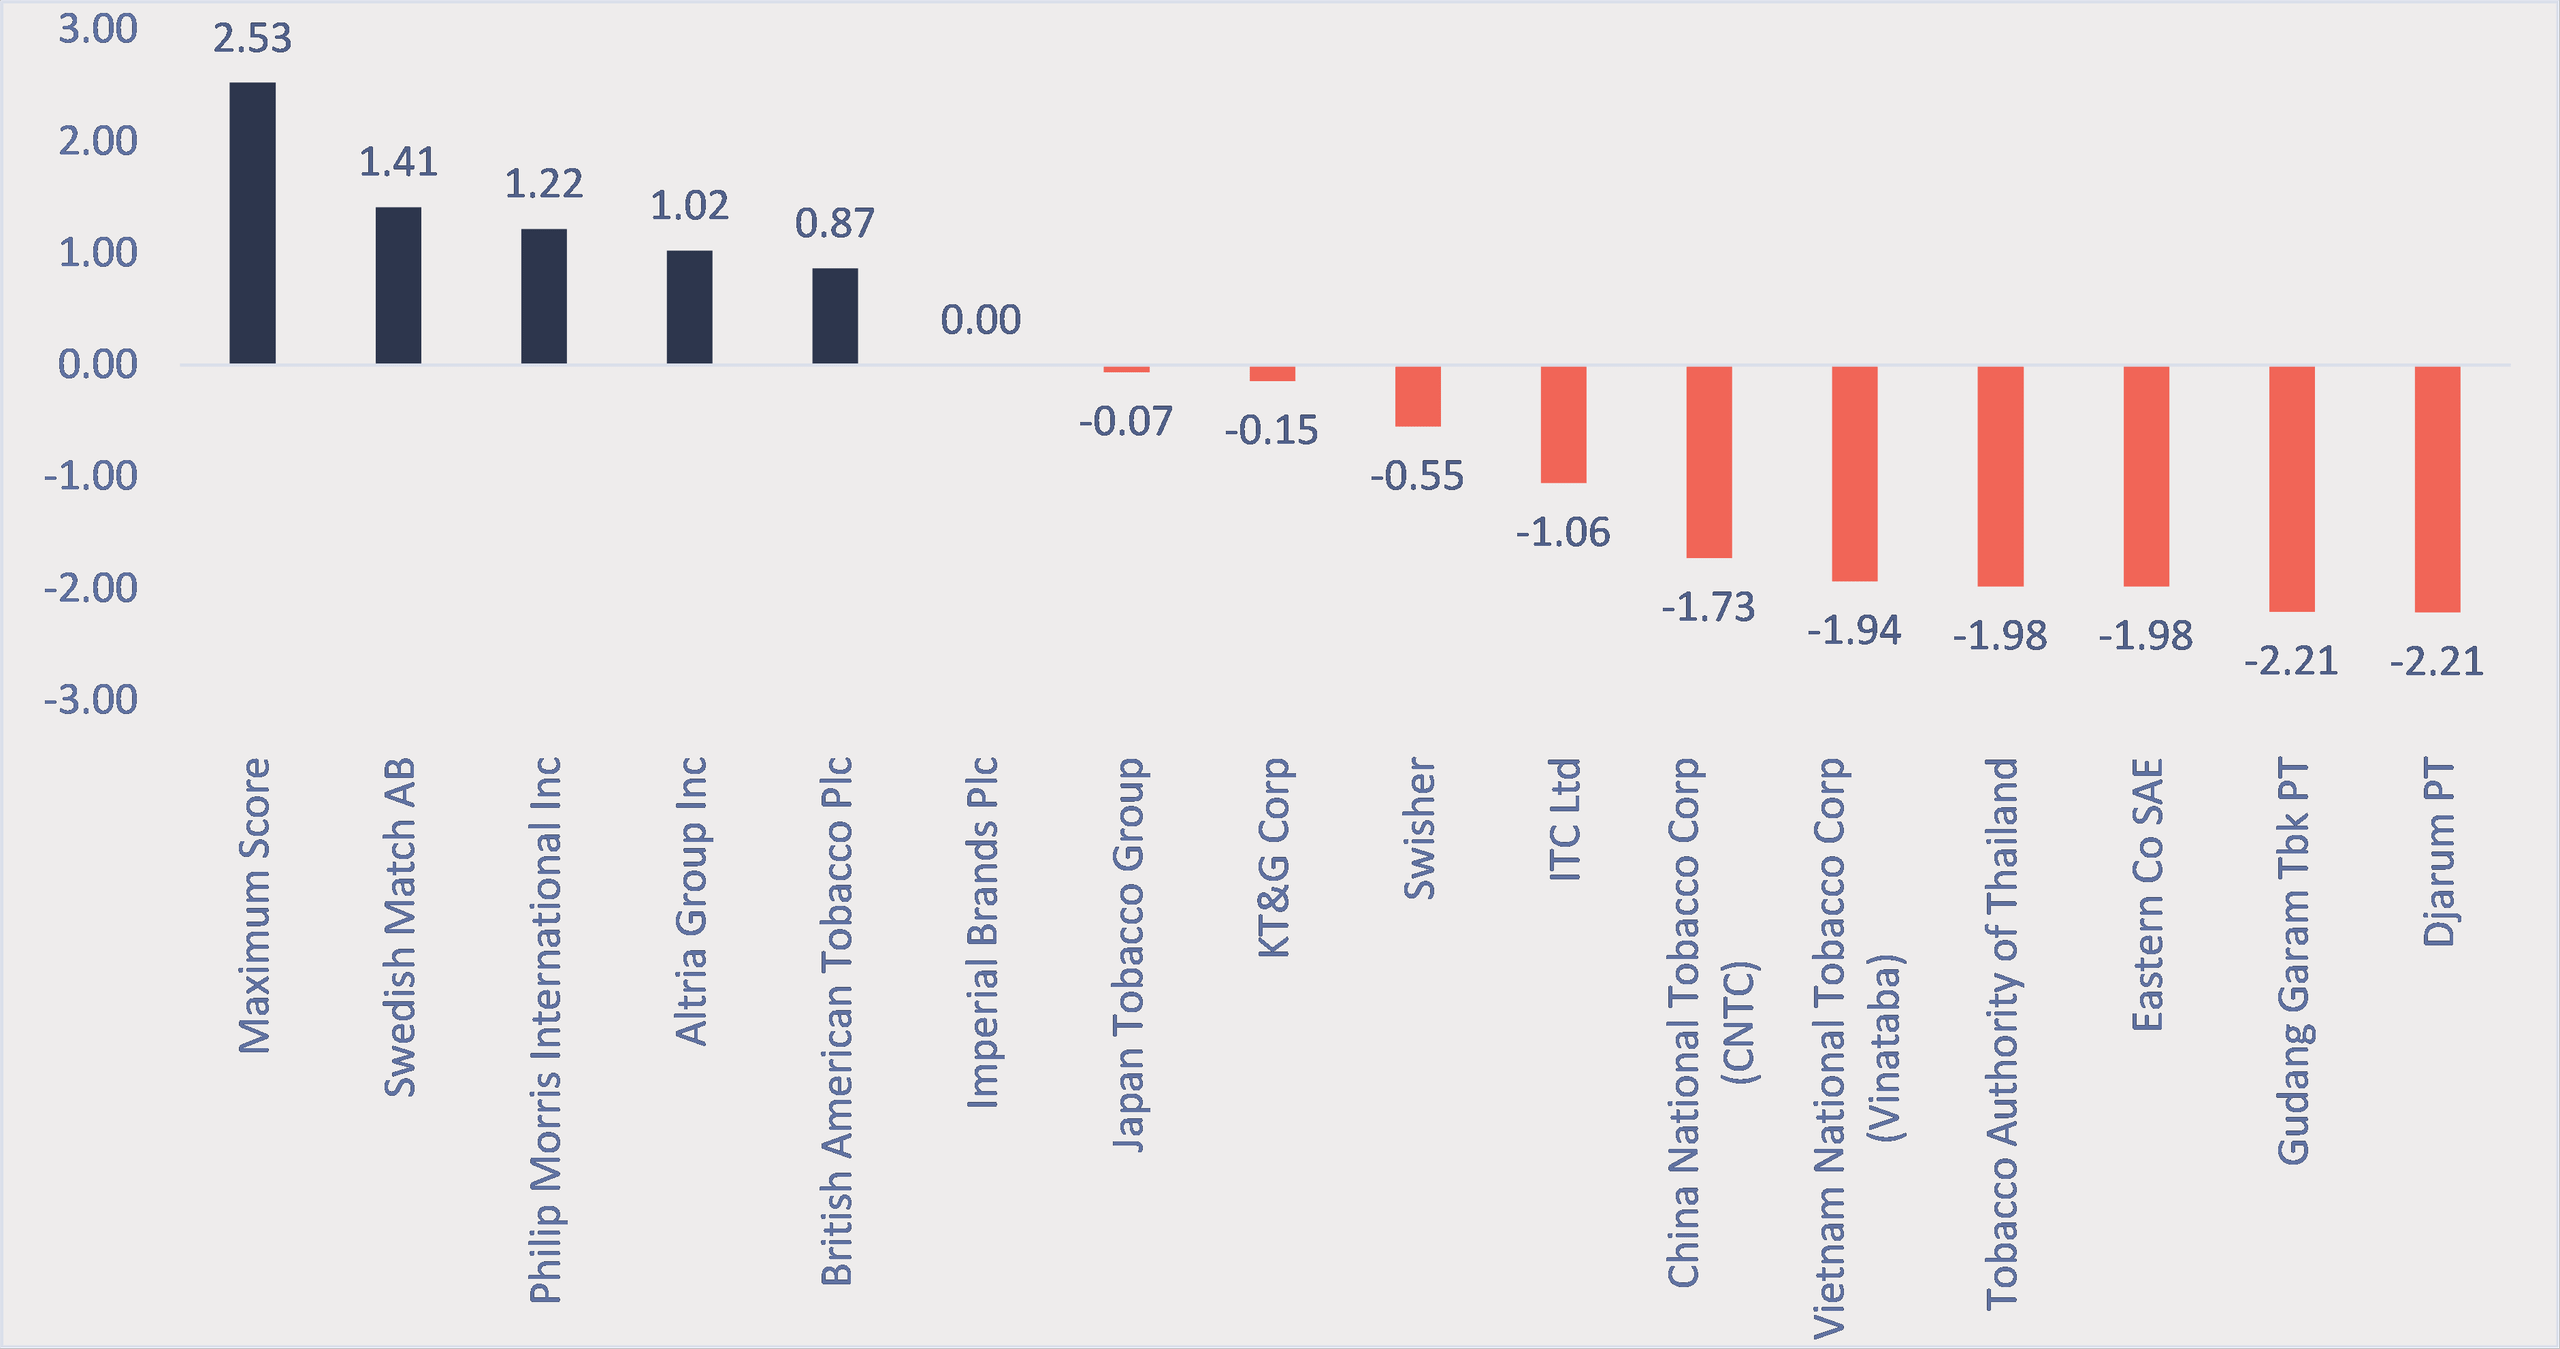
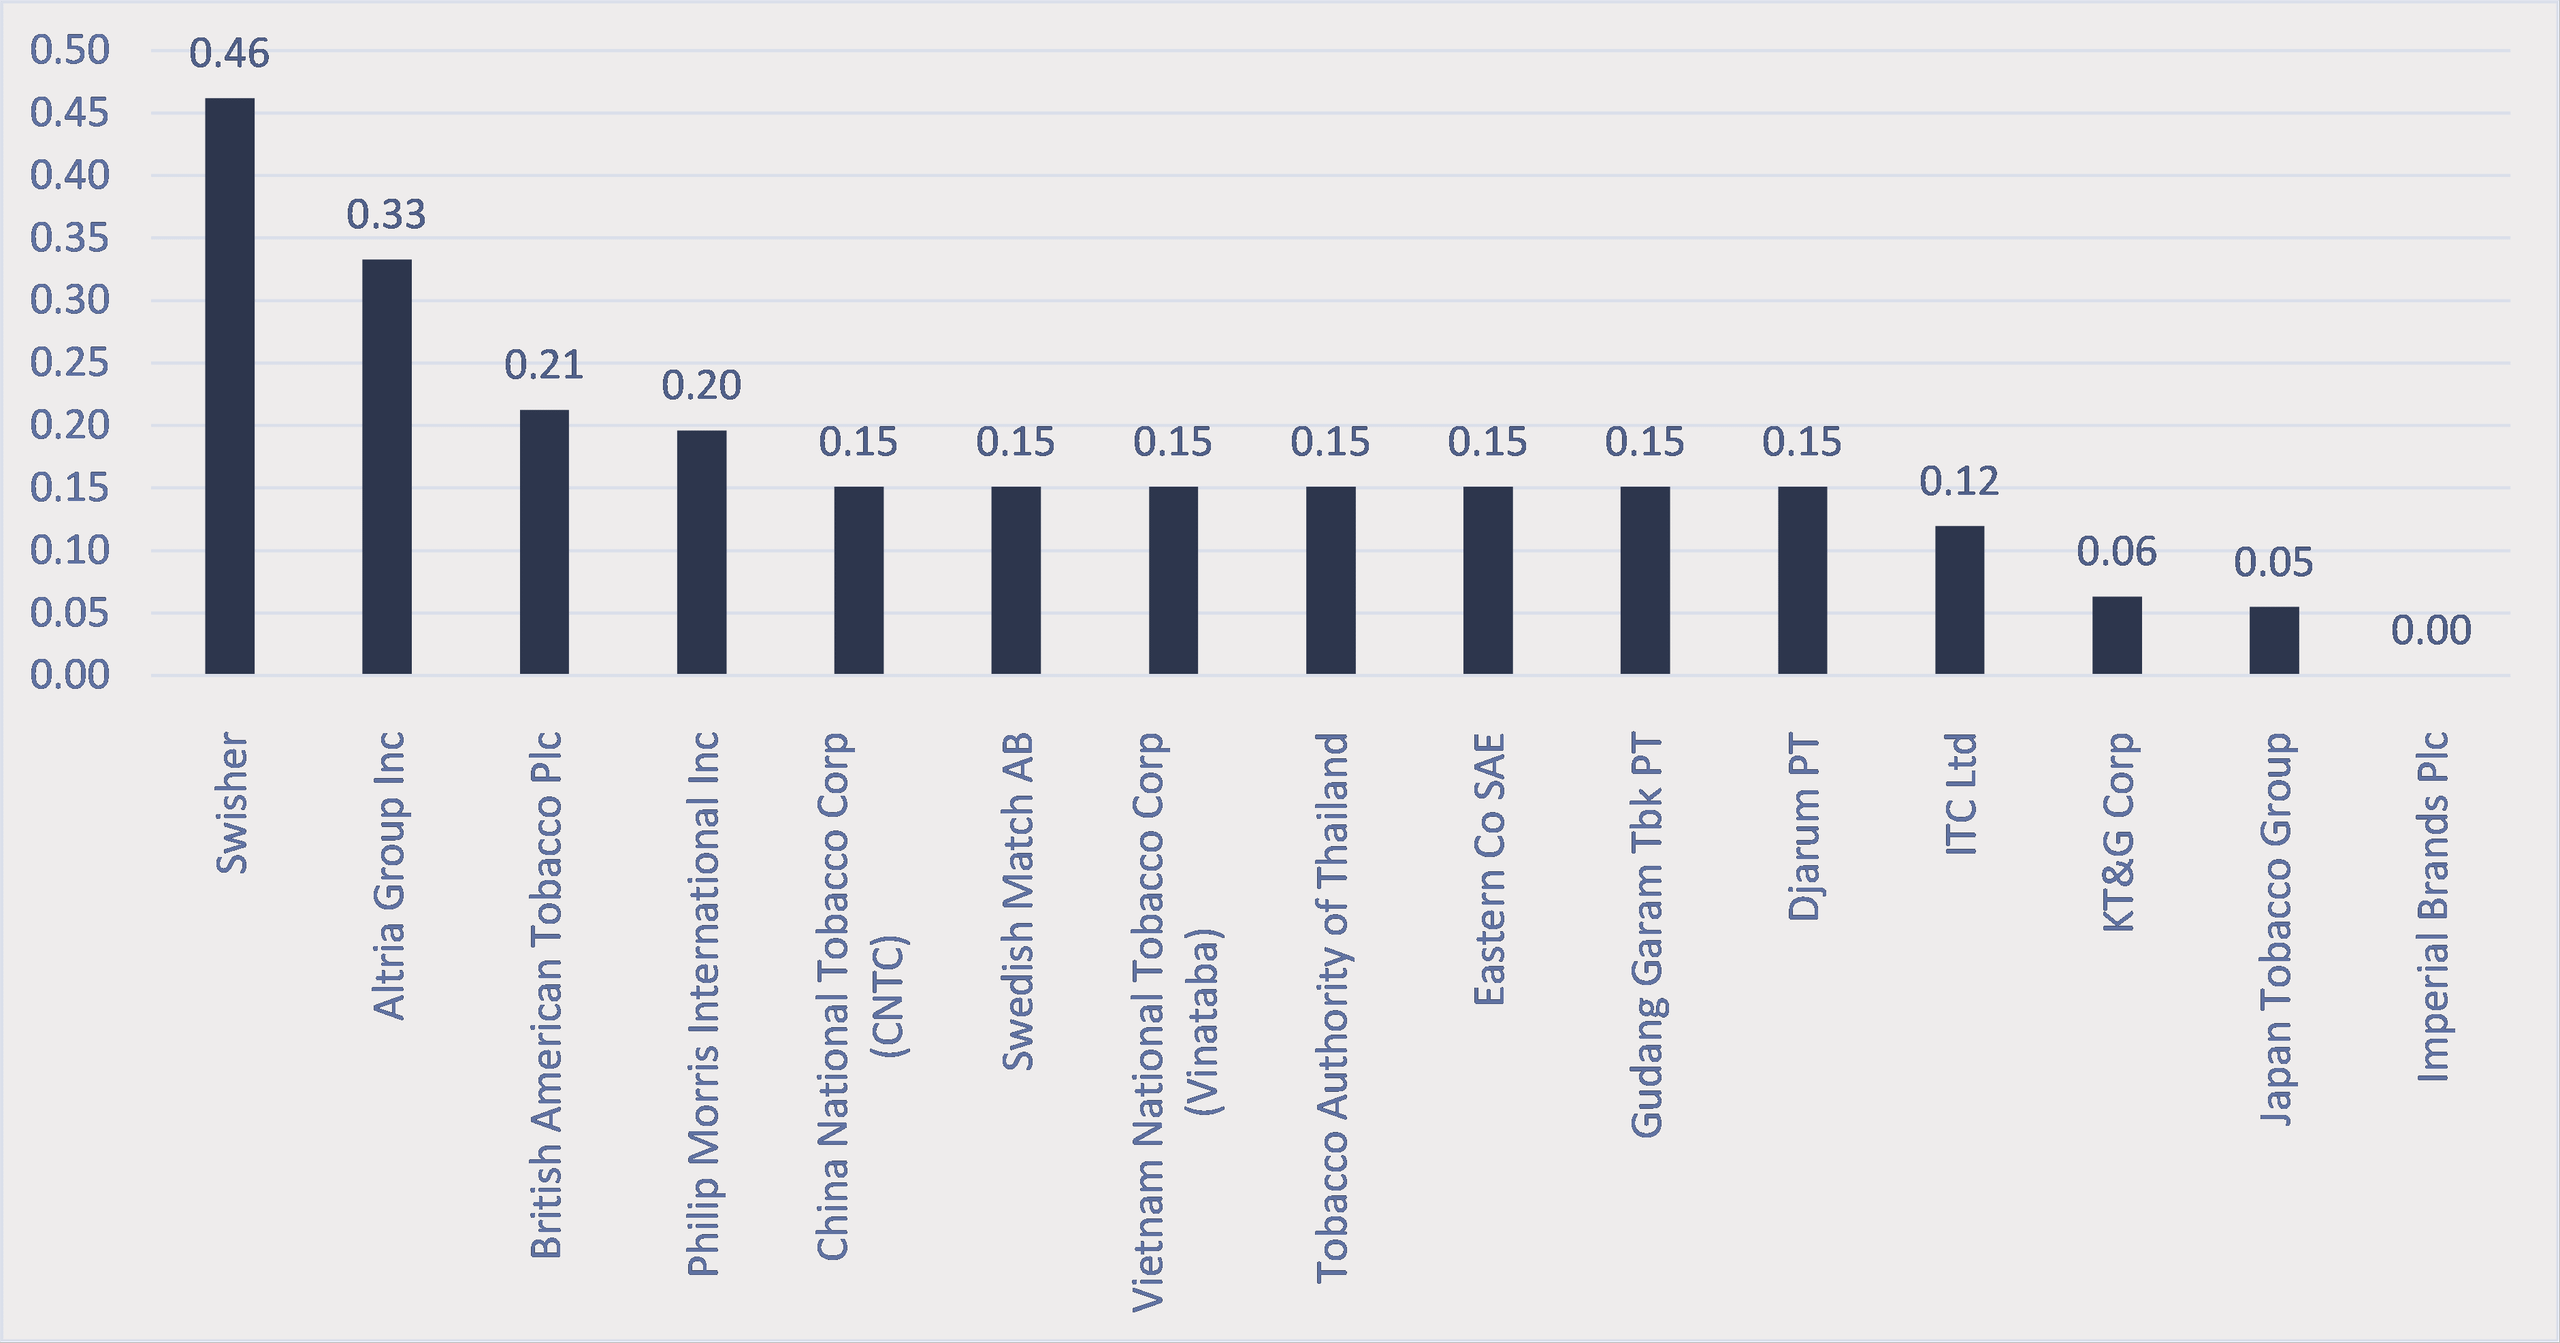
The relative Product Sales score changes have left Imperial’s
score now modestly below JT Group, with reduced leads over those ranked below
it and more significant gaps with those ranked higher.
Product Sales Score differences with Imperial Brands Plc (0.43)

Source: Tobacco Transformation Index, Idwala Research
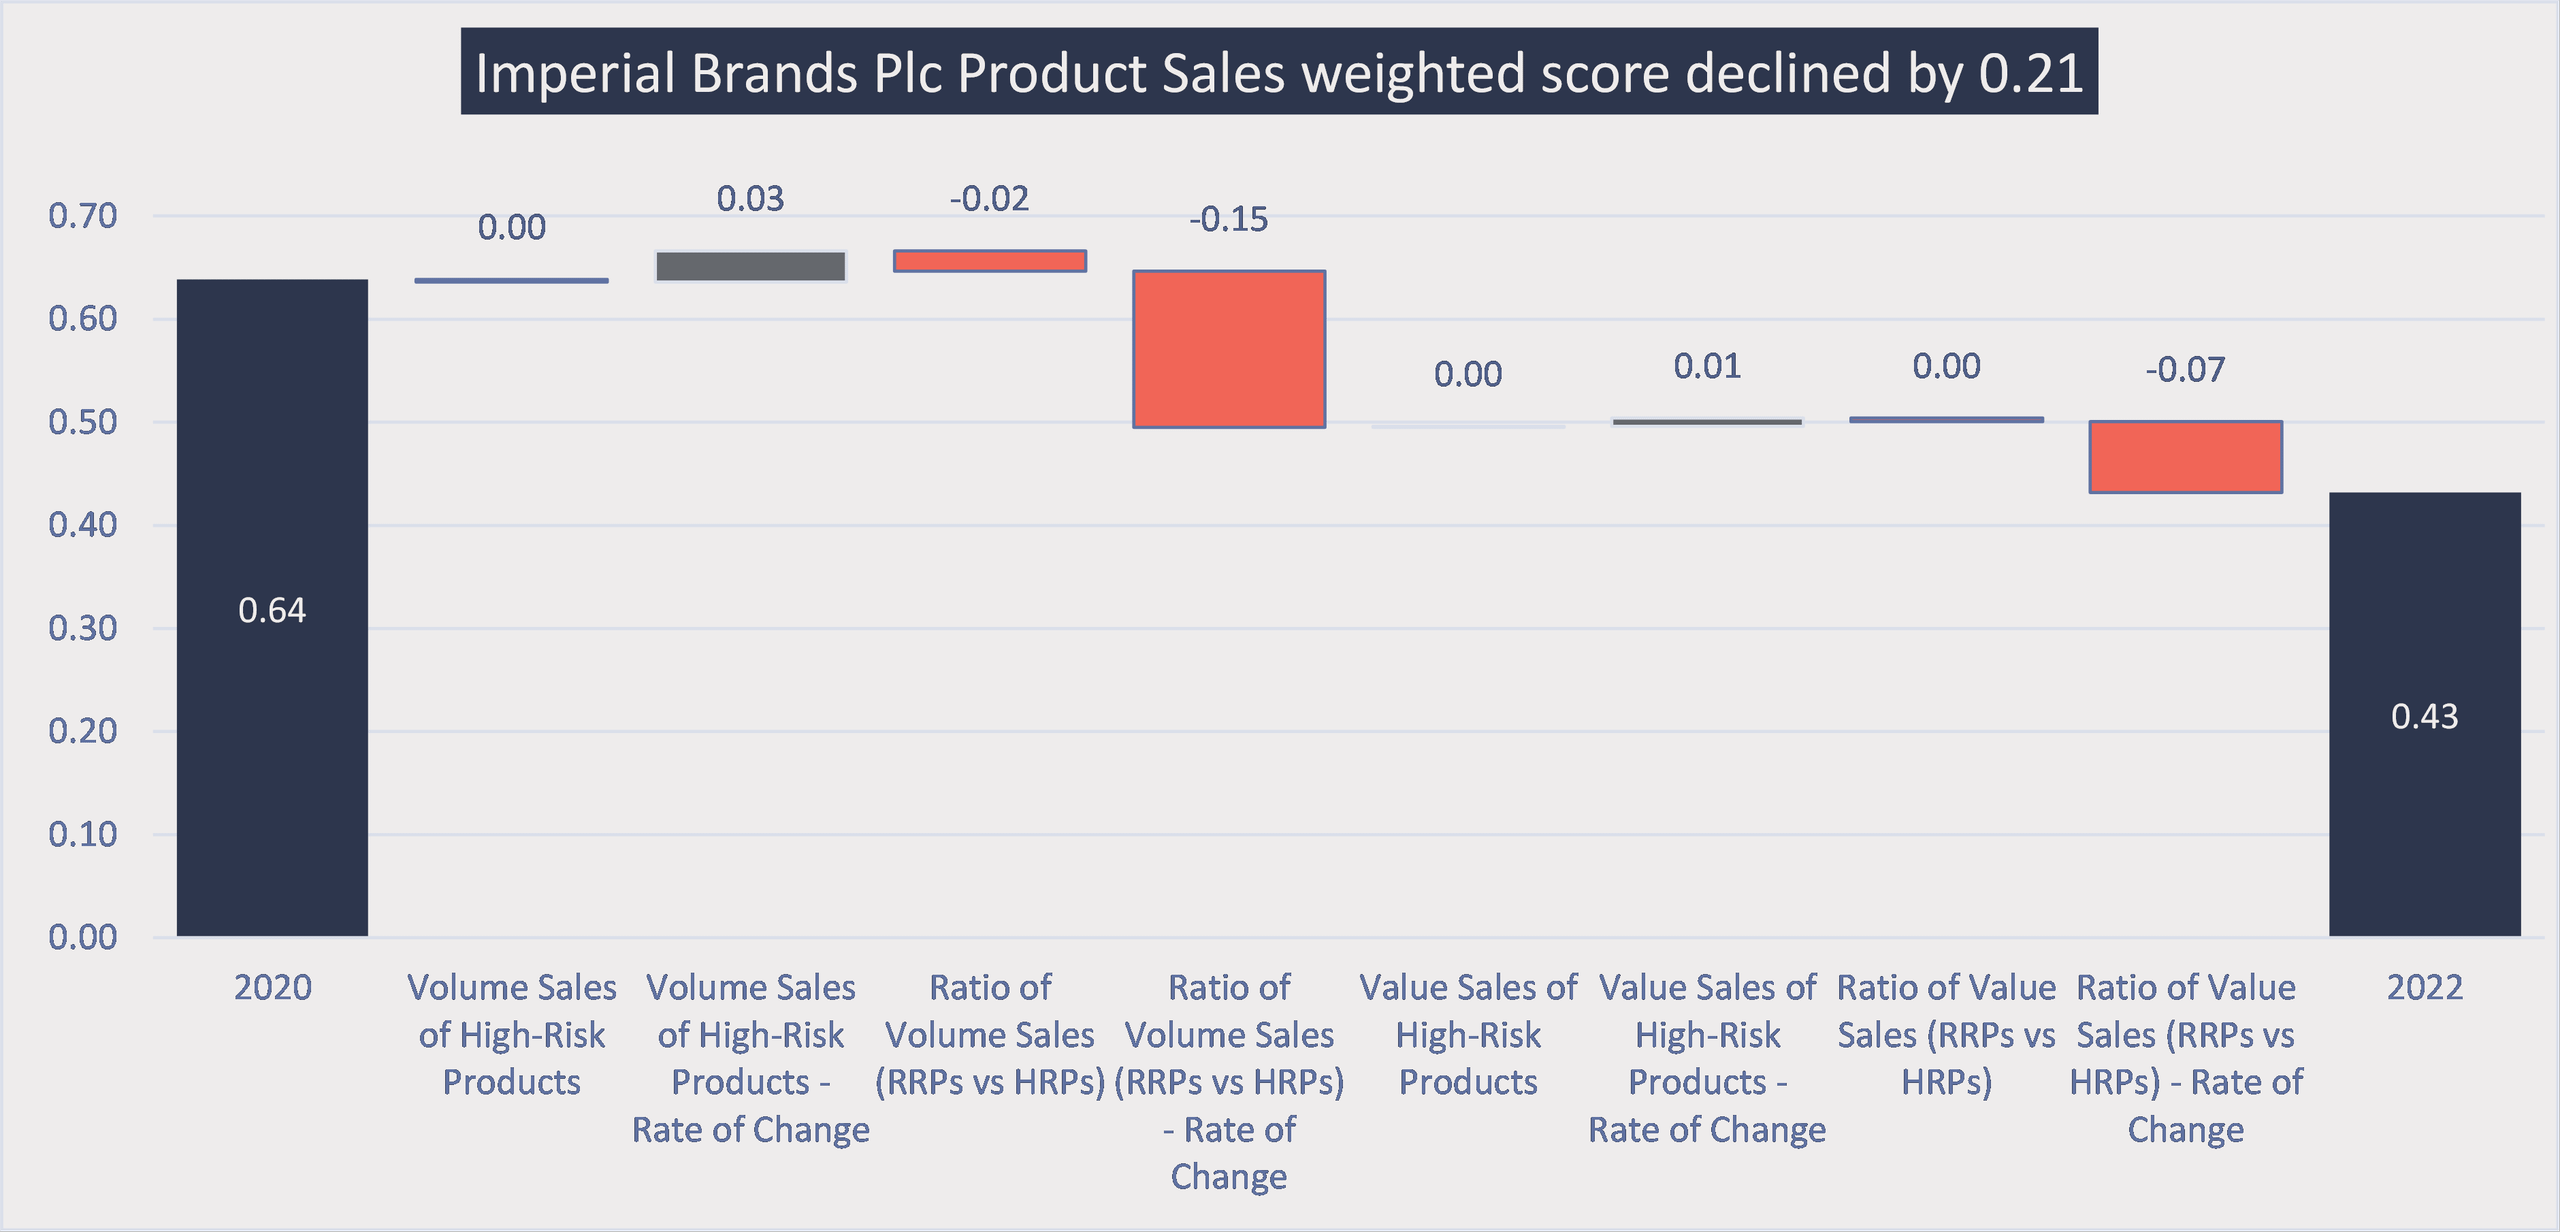
The RRP/HRP ratio rate of change indicators were the main
drivers of Imperial’s 0.21 Product Sales weighted score decline. The rate of
decline in the volume ratio was the most significant contributor, as shown in
the chart below. These declines followed a strategic decision by the company to
withdraw its closed-system vaping product from Russia and Japan and its heated
tobacco product from Japan.
Indicator contribution to Imperial Brands Plc Product Sales weighted score change
Source: Tobacco Transformation Index, Idwala Research
Imperial’s 0.15 weighted score decline in this indicator was
also the biggest in the Index, with JT Group, KT&G and ITC recording more
modest declines, as shown in the chart below.
Ratio of Volume Sales (RRPs vs HRPs) - Rate of Change Score changes relative to Imperial Brands Plc (-0.15)
Source: Tobacco Transformation Index, Idwala Research
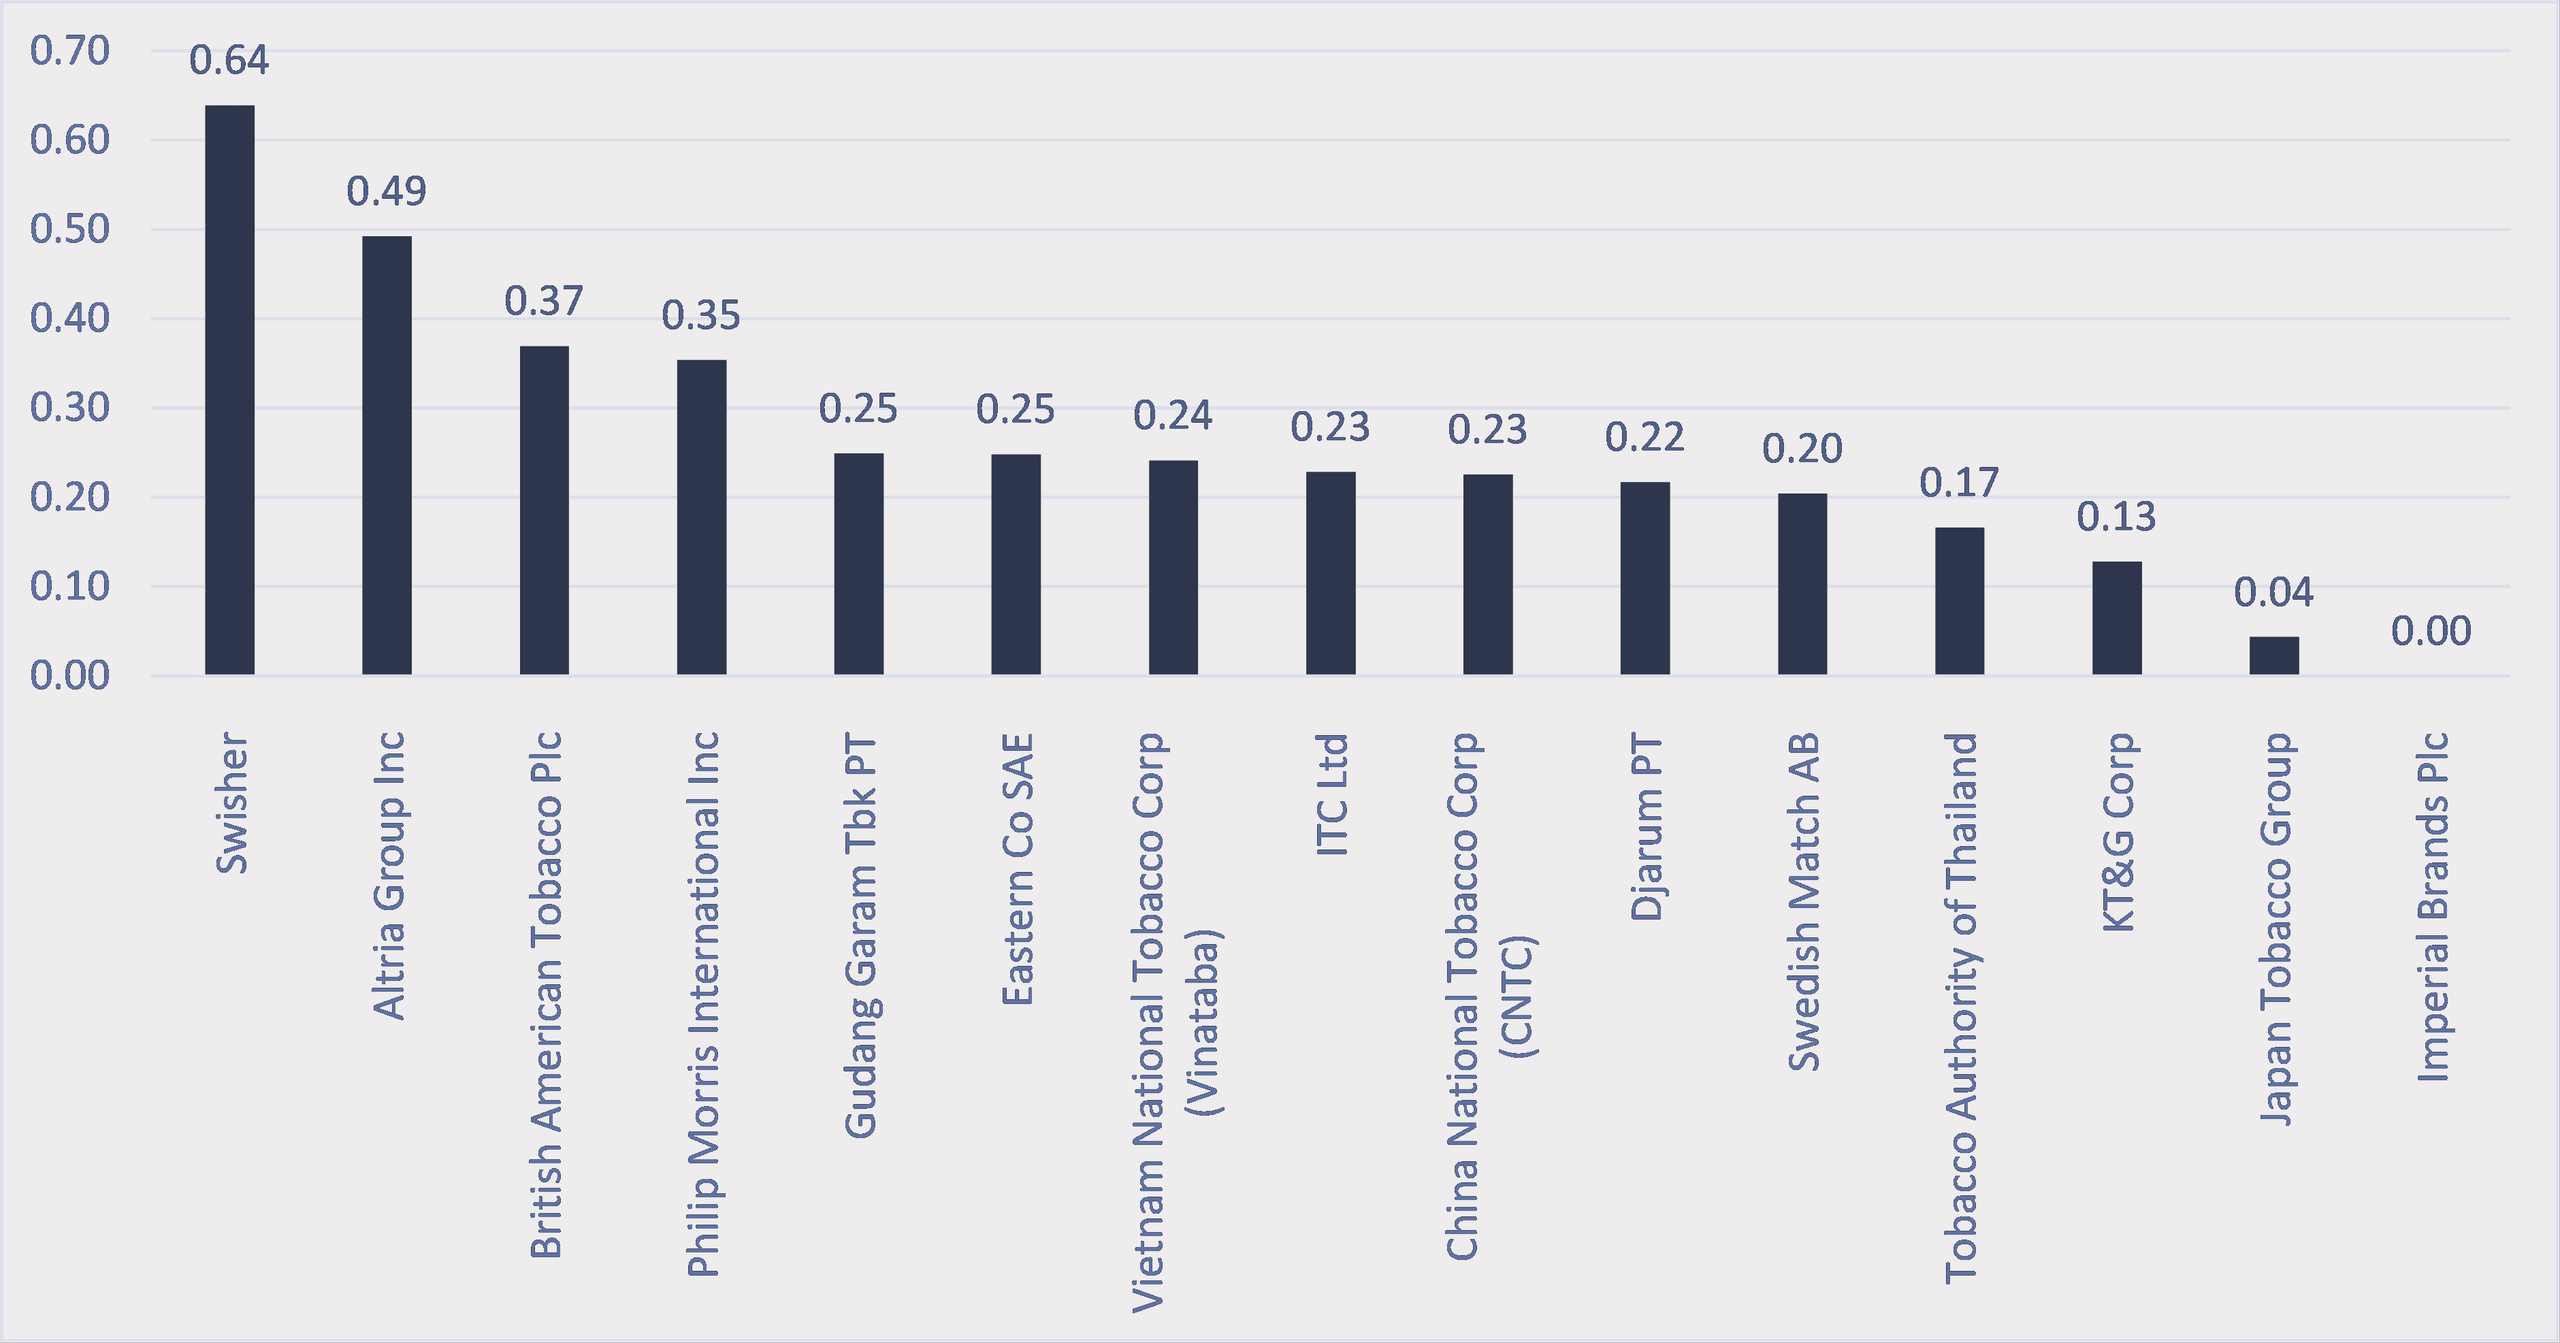
Considering that Imperial’s score for this indicator
declined by 0.15, its 2022 score of 0.10 is within striking distance of those
who scored zero ranked below it and 2-3 of those who were ranked higher. (chart
below)
Ratio of Volume Sales (RRPs vs HRPs) - Rate of Change Score differences with Imperial Brands Plc (0.10)
Source: Tobacco Transformation Index, Idwala Research
Peer-to-peer comparison
Imperial may compare itself ranked closest to it to establish what would be required to improve its ranking or where it is most vulnerable to a lower ranking.
Comparison to Japan Tobacco Group
In 2022, Imperial’s Final Score was 0.07 higher than JT Group’s. Capital Allocation & Expenditure (0.18) was the most significant contributor, partly offset by Product Offer (-0.09).
Category contribution to Final Score difference: Japan Tobacco Group & Imperial Brands Plc
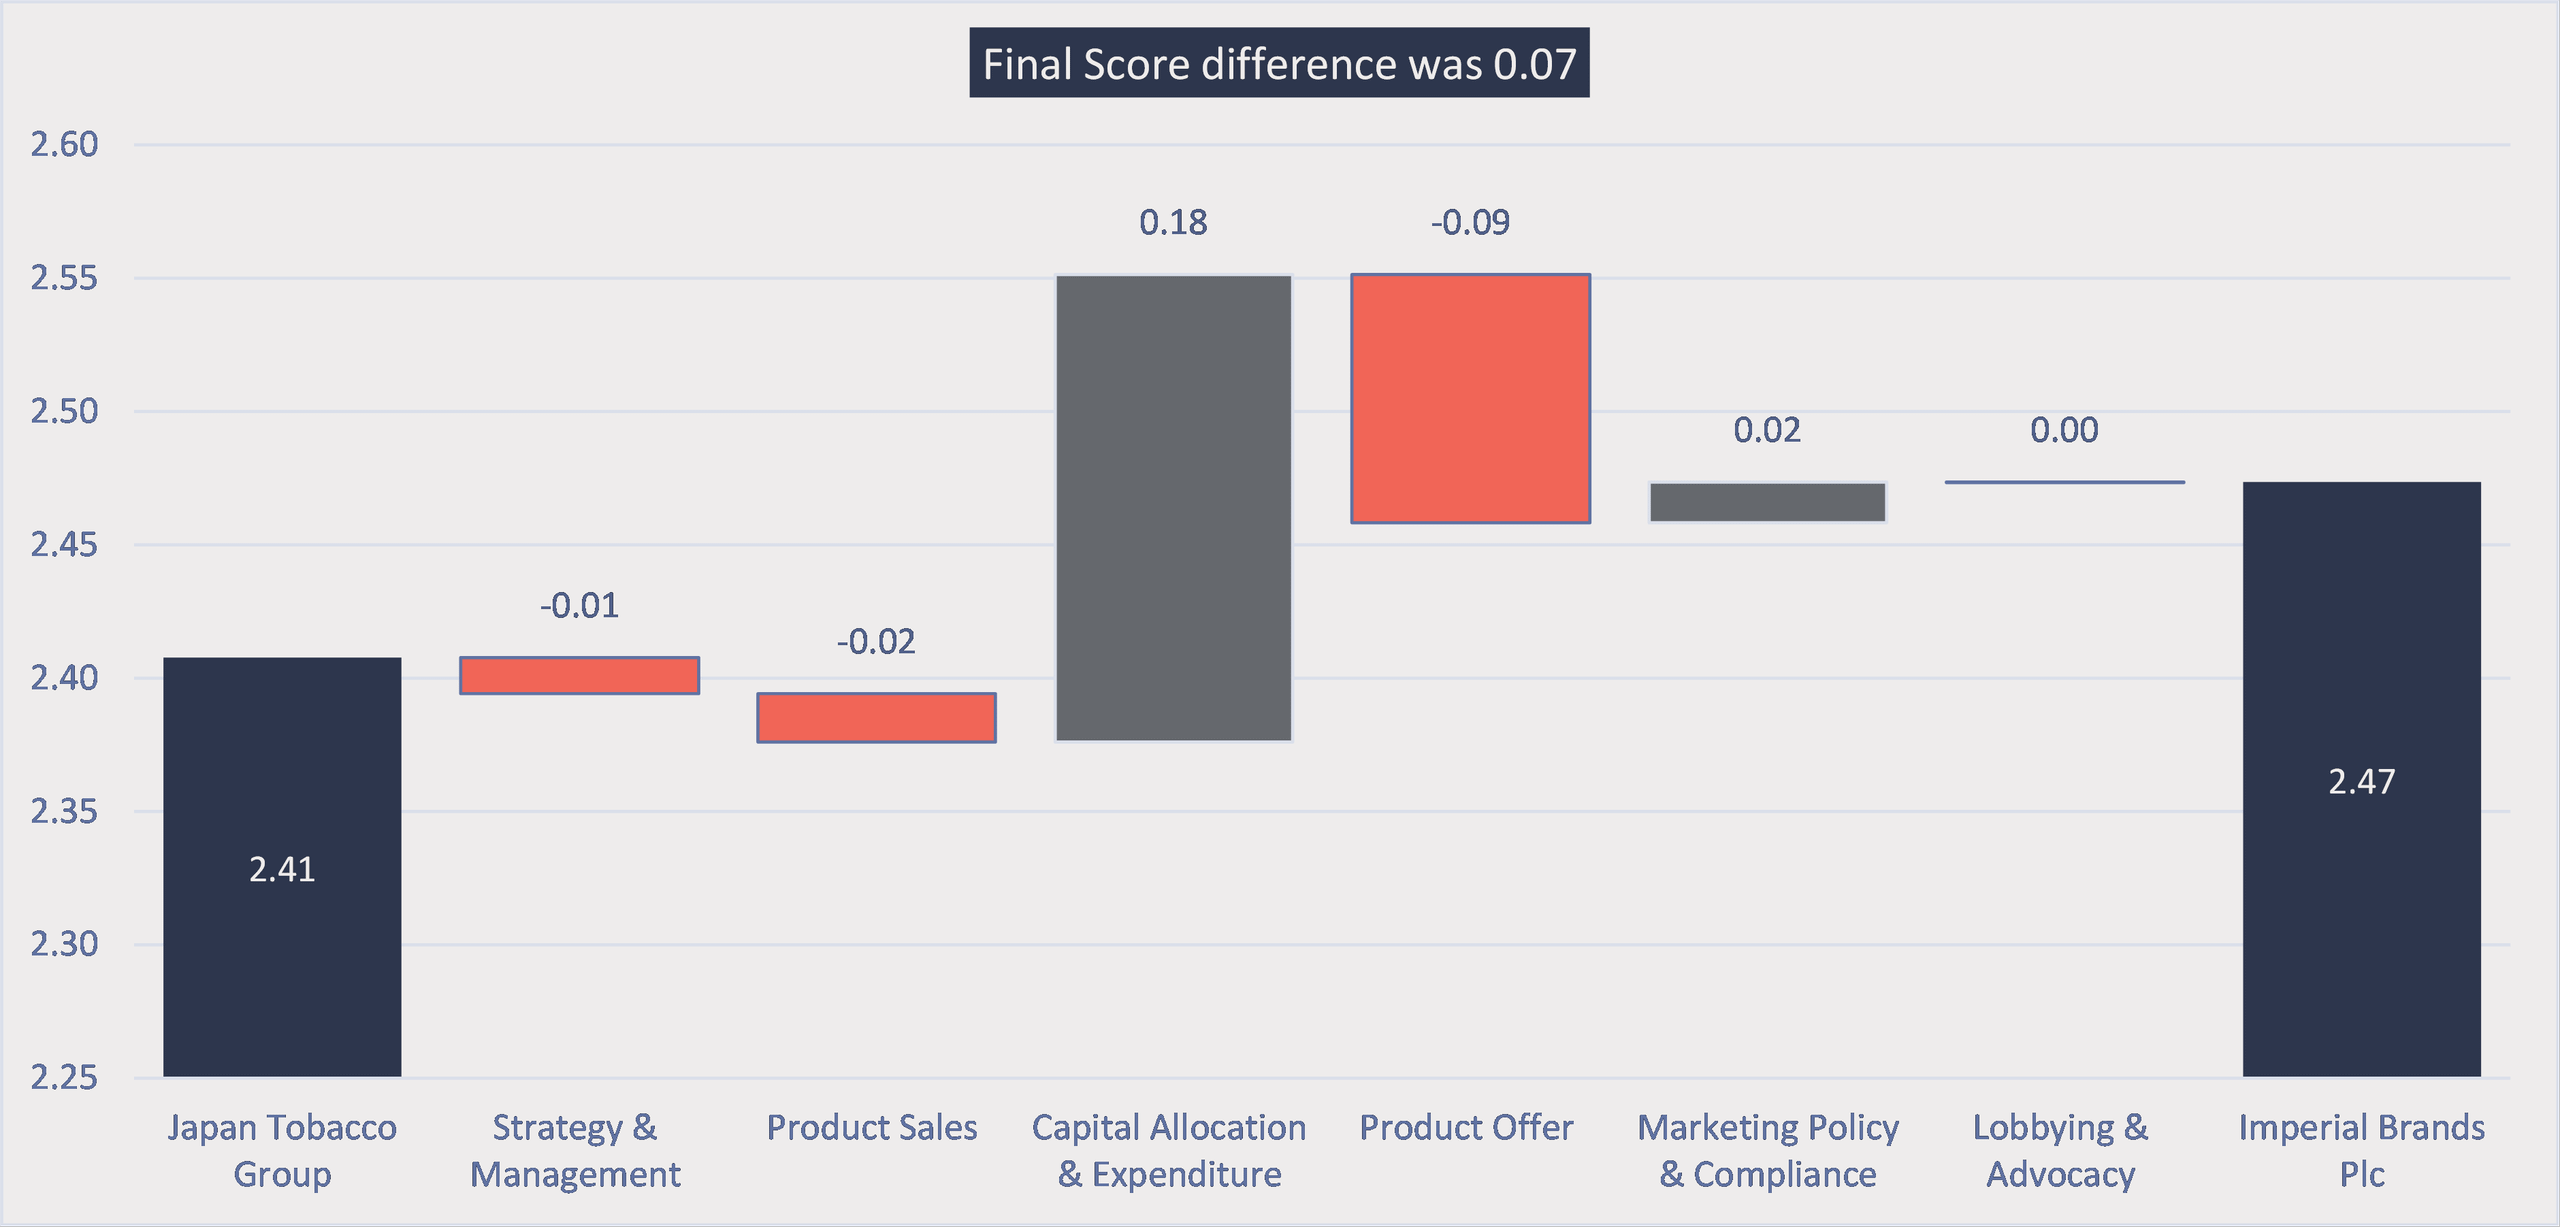
Source: Tobacco Transformation Index, Idwala Research
*Figures don't match owing to rounding
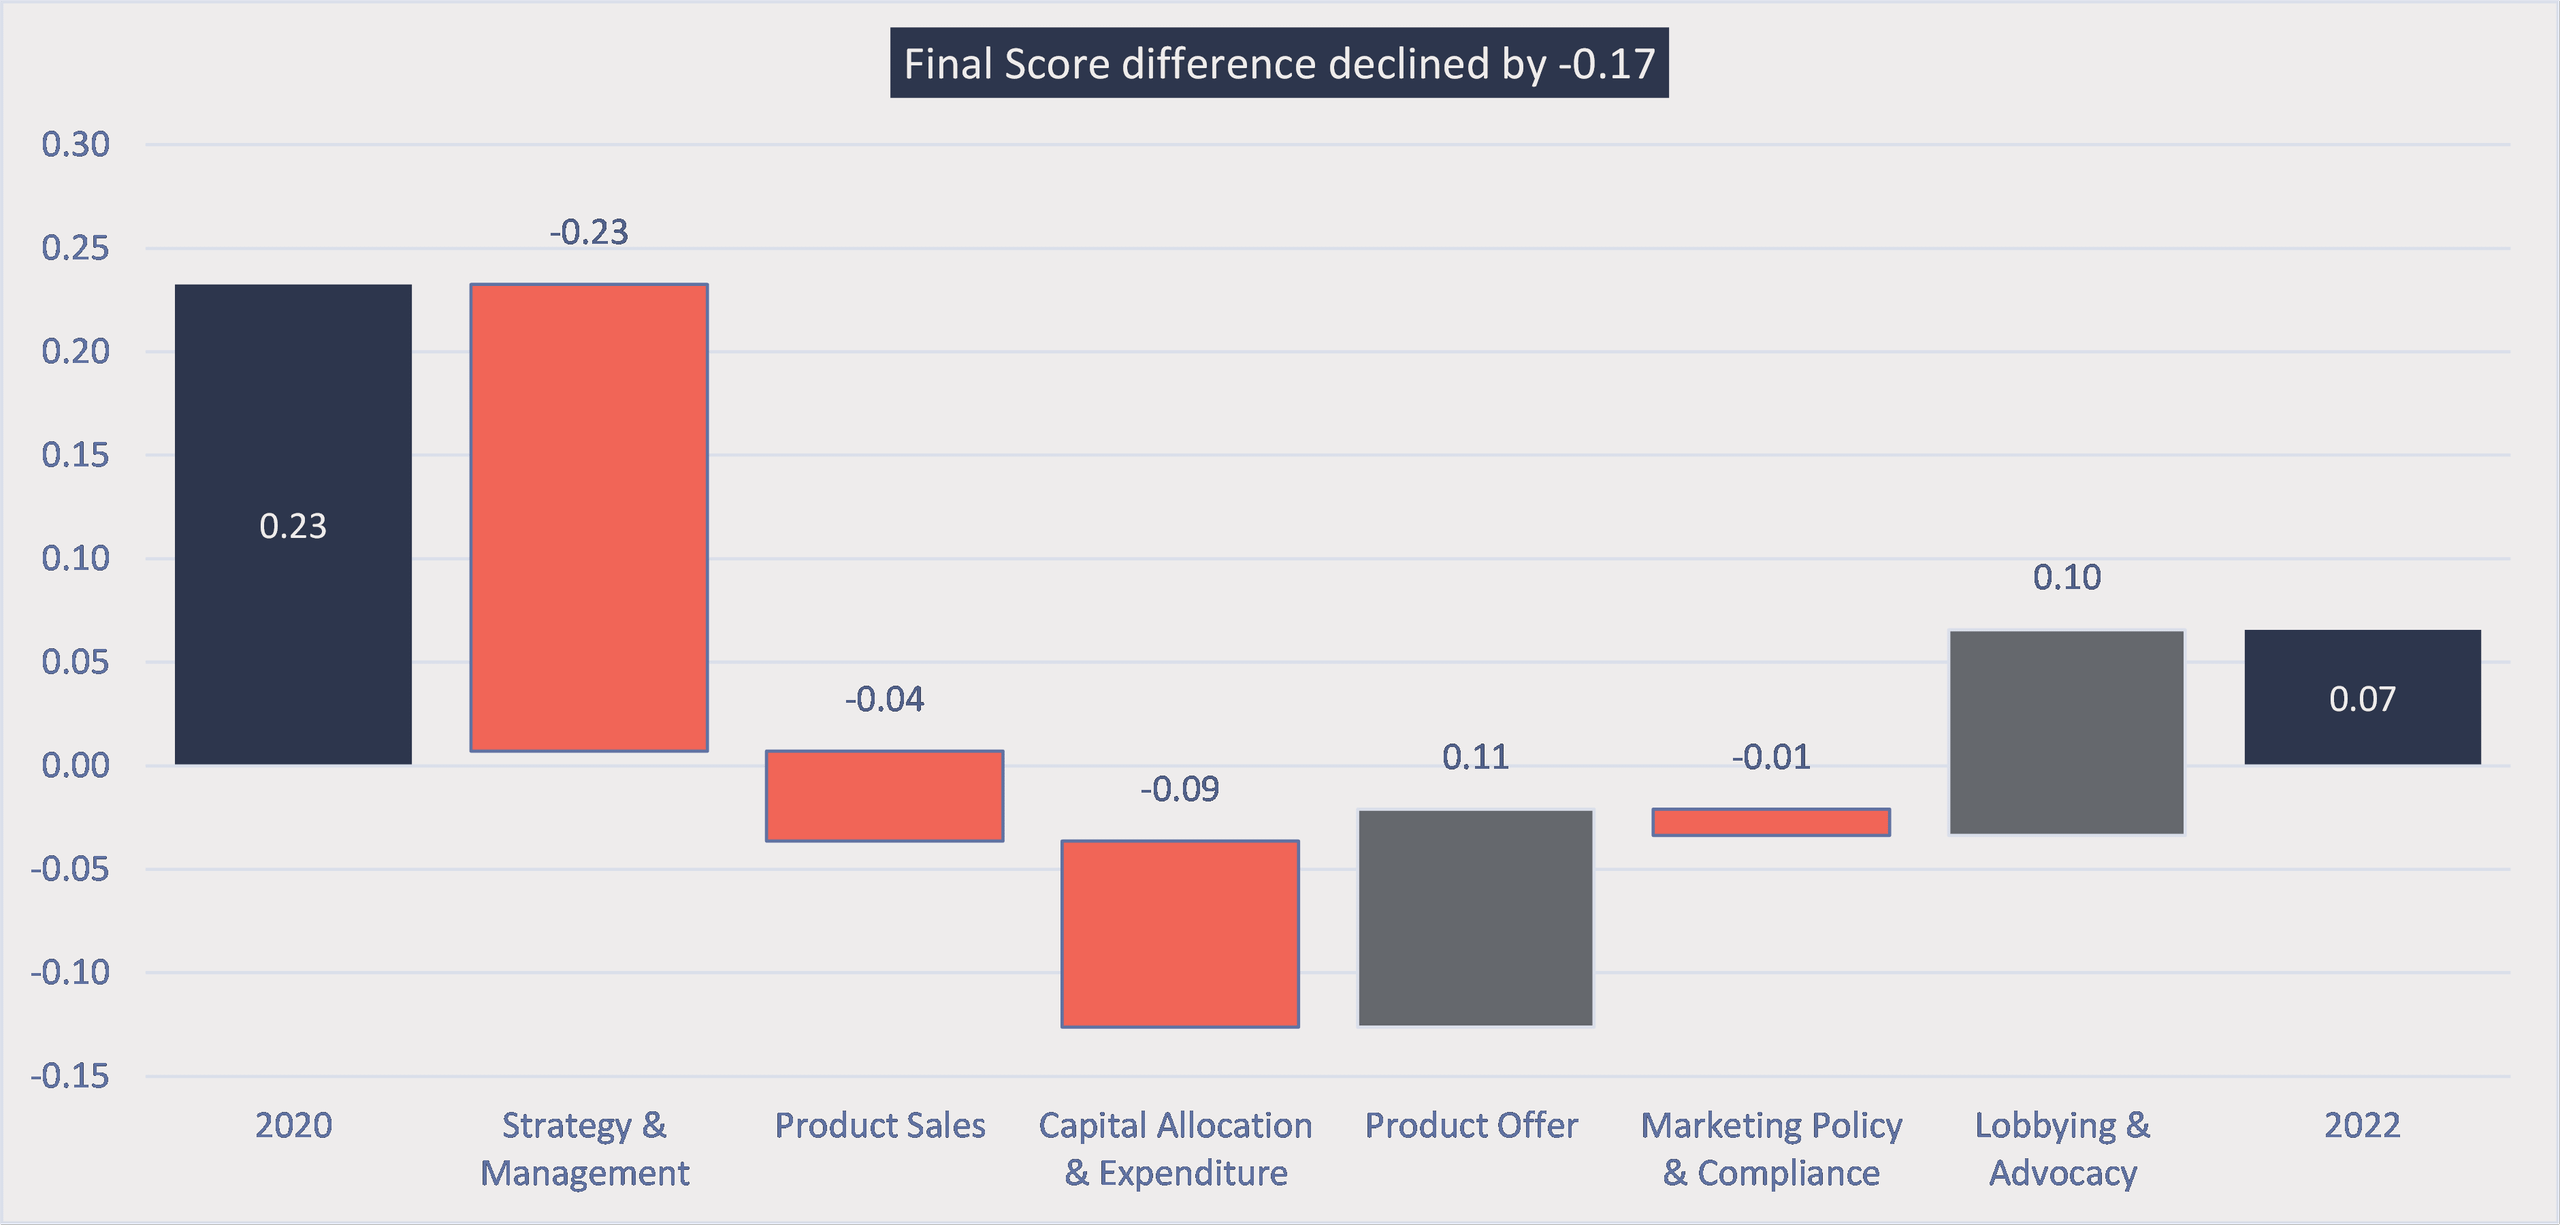
From 2020 to 2022, the Final Score difference between
Imperial and JT Group declined by a substantial 0.17, mainly because JT Group improved
its Strategy & Management Score and recorded lower score reductions than
Imperial in Product Sales and Capital Allocation & Expenditure. Partly
offsetting these were a lower score reduction for Imperial in Product Offer and
a score decline in Lobbying & Advocacy for JT Group.
Category contribution to change in Final Score difference: Imperial Brands Plc less Japan Tobacco Group
Source: Tobacco Transformation Index, Idwala Research
*Figures don't match owing to rounding
Comparison to Swisher on Product Sales
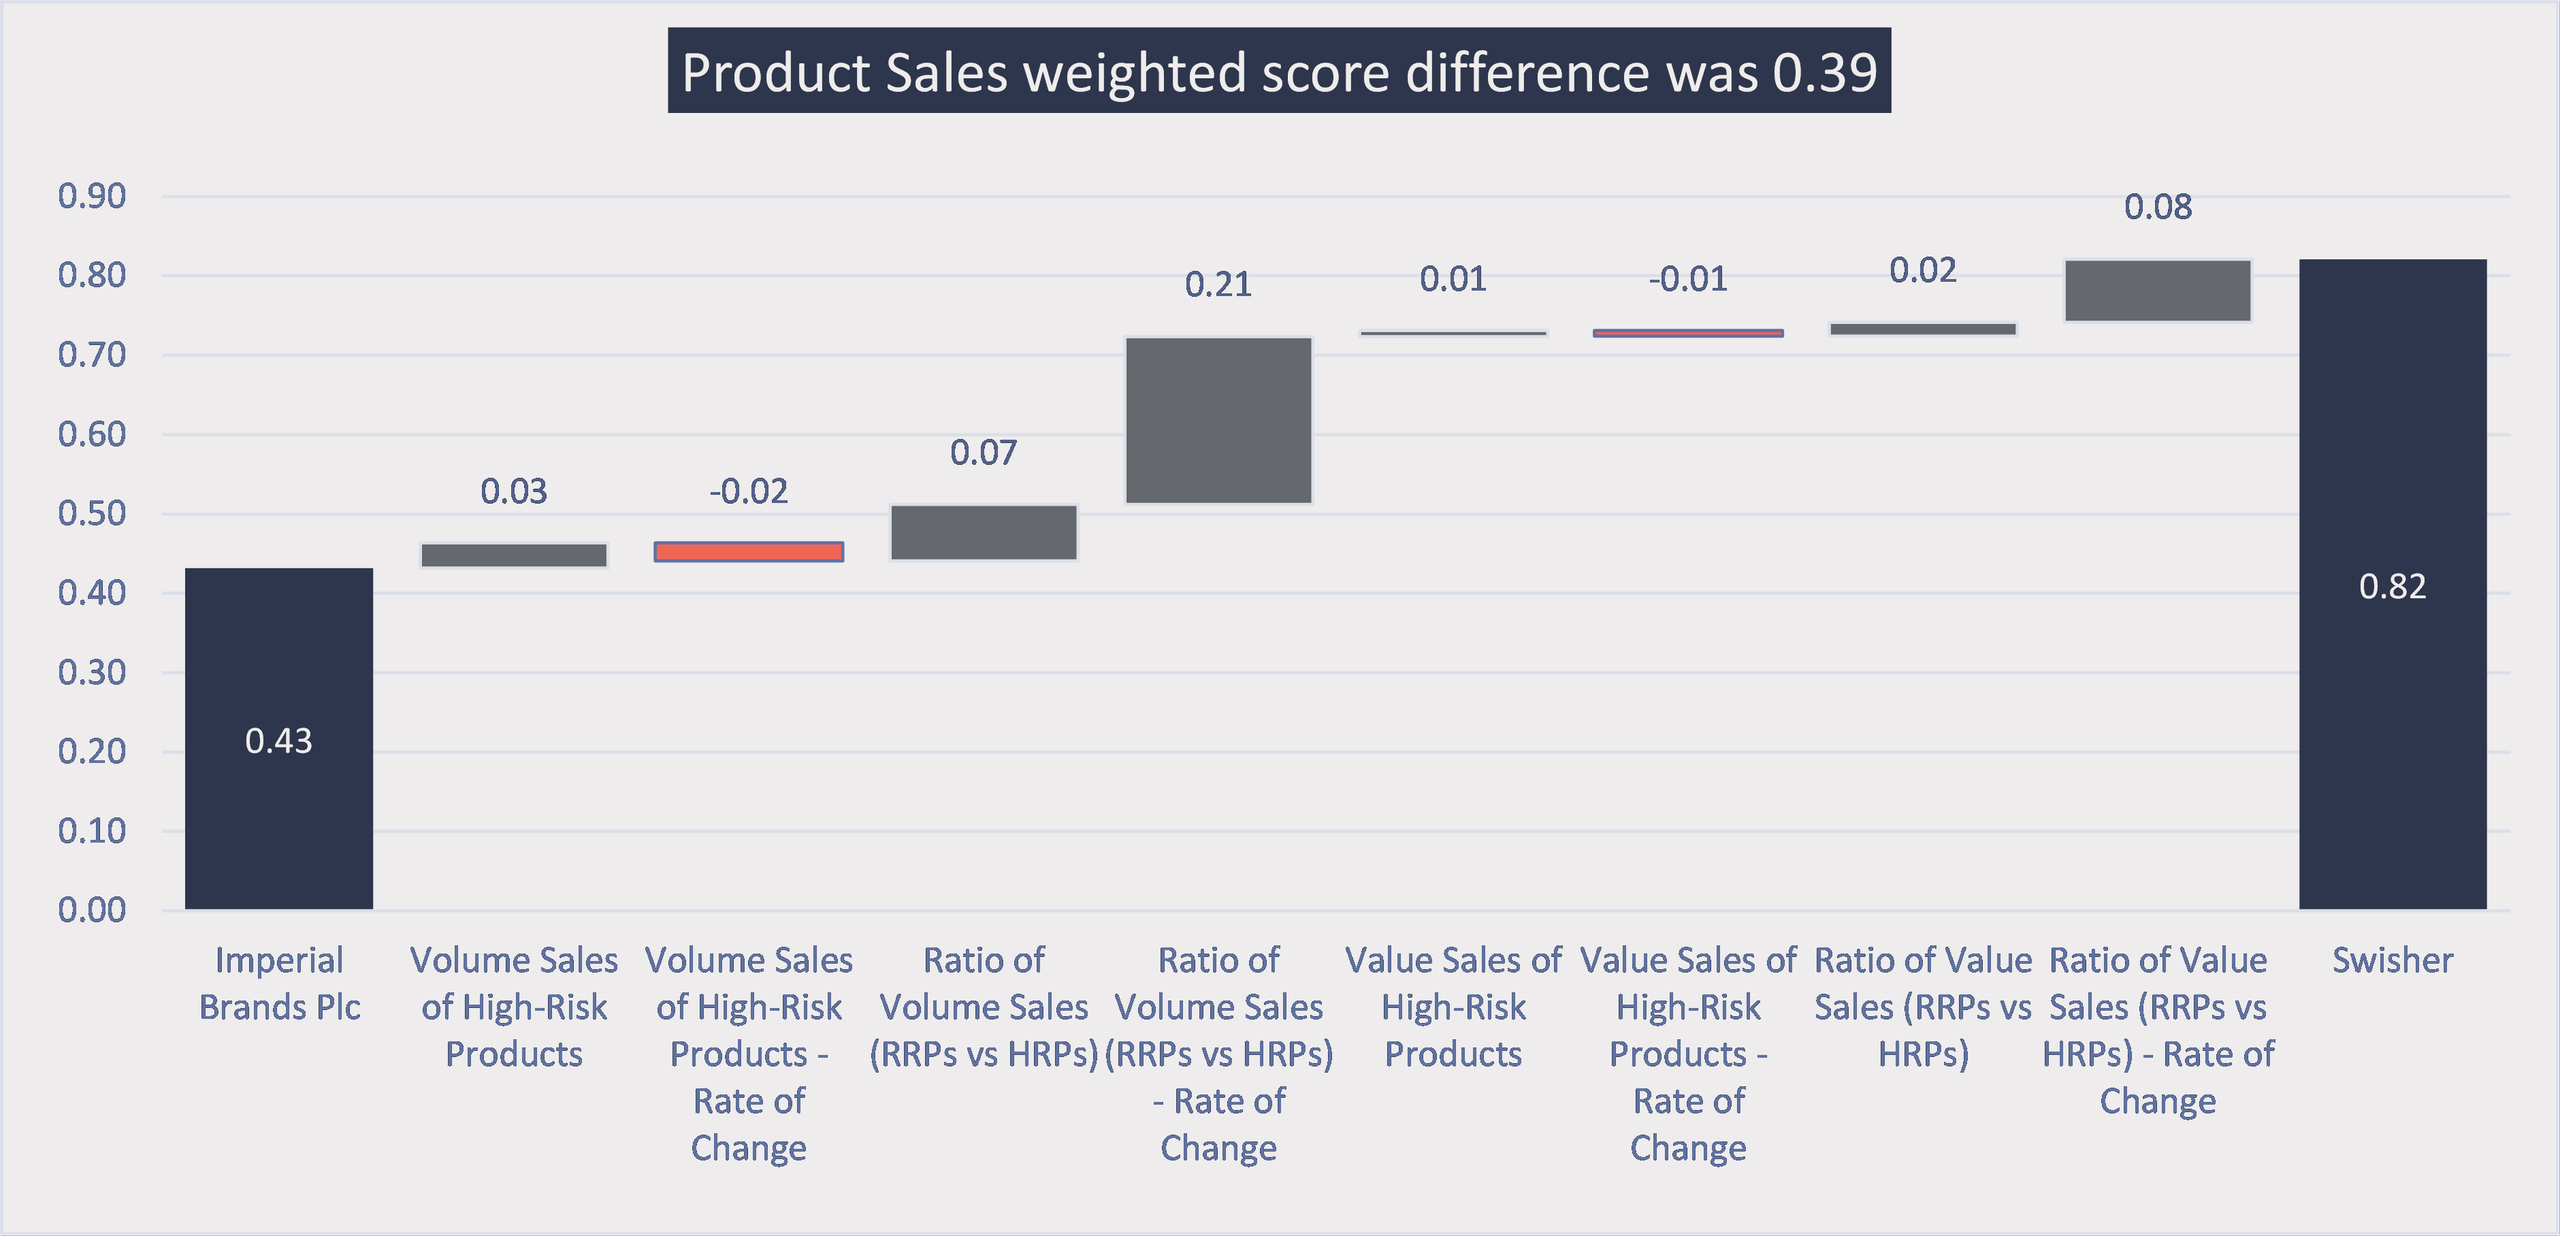
Whereas the Product Sales category was the most significant contributor to Imperial’s lower score, it accounted for most of Swisher’s Final Score increase.
In 2022, Swisher’s Product Sales weighted score of 0.82 was 0.39 higher than Imperial’s 0.43. The RRP/HRP ratio indicators, particularly the rate of change, were the most significant contributors to this score difference.
Indicator contribution to Product Sales weighted score difference: Imperial Brands Plc & Swisher
Source: Tobacco Transformation Index, Idwala Research
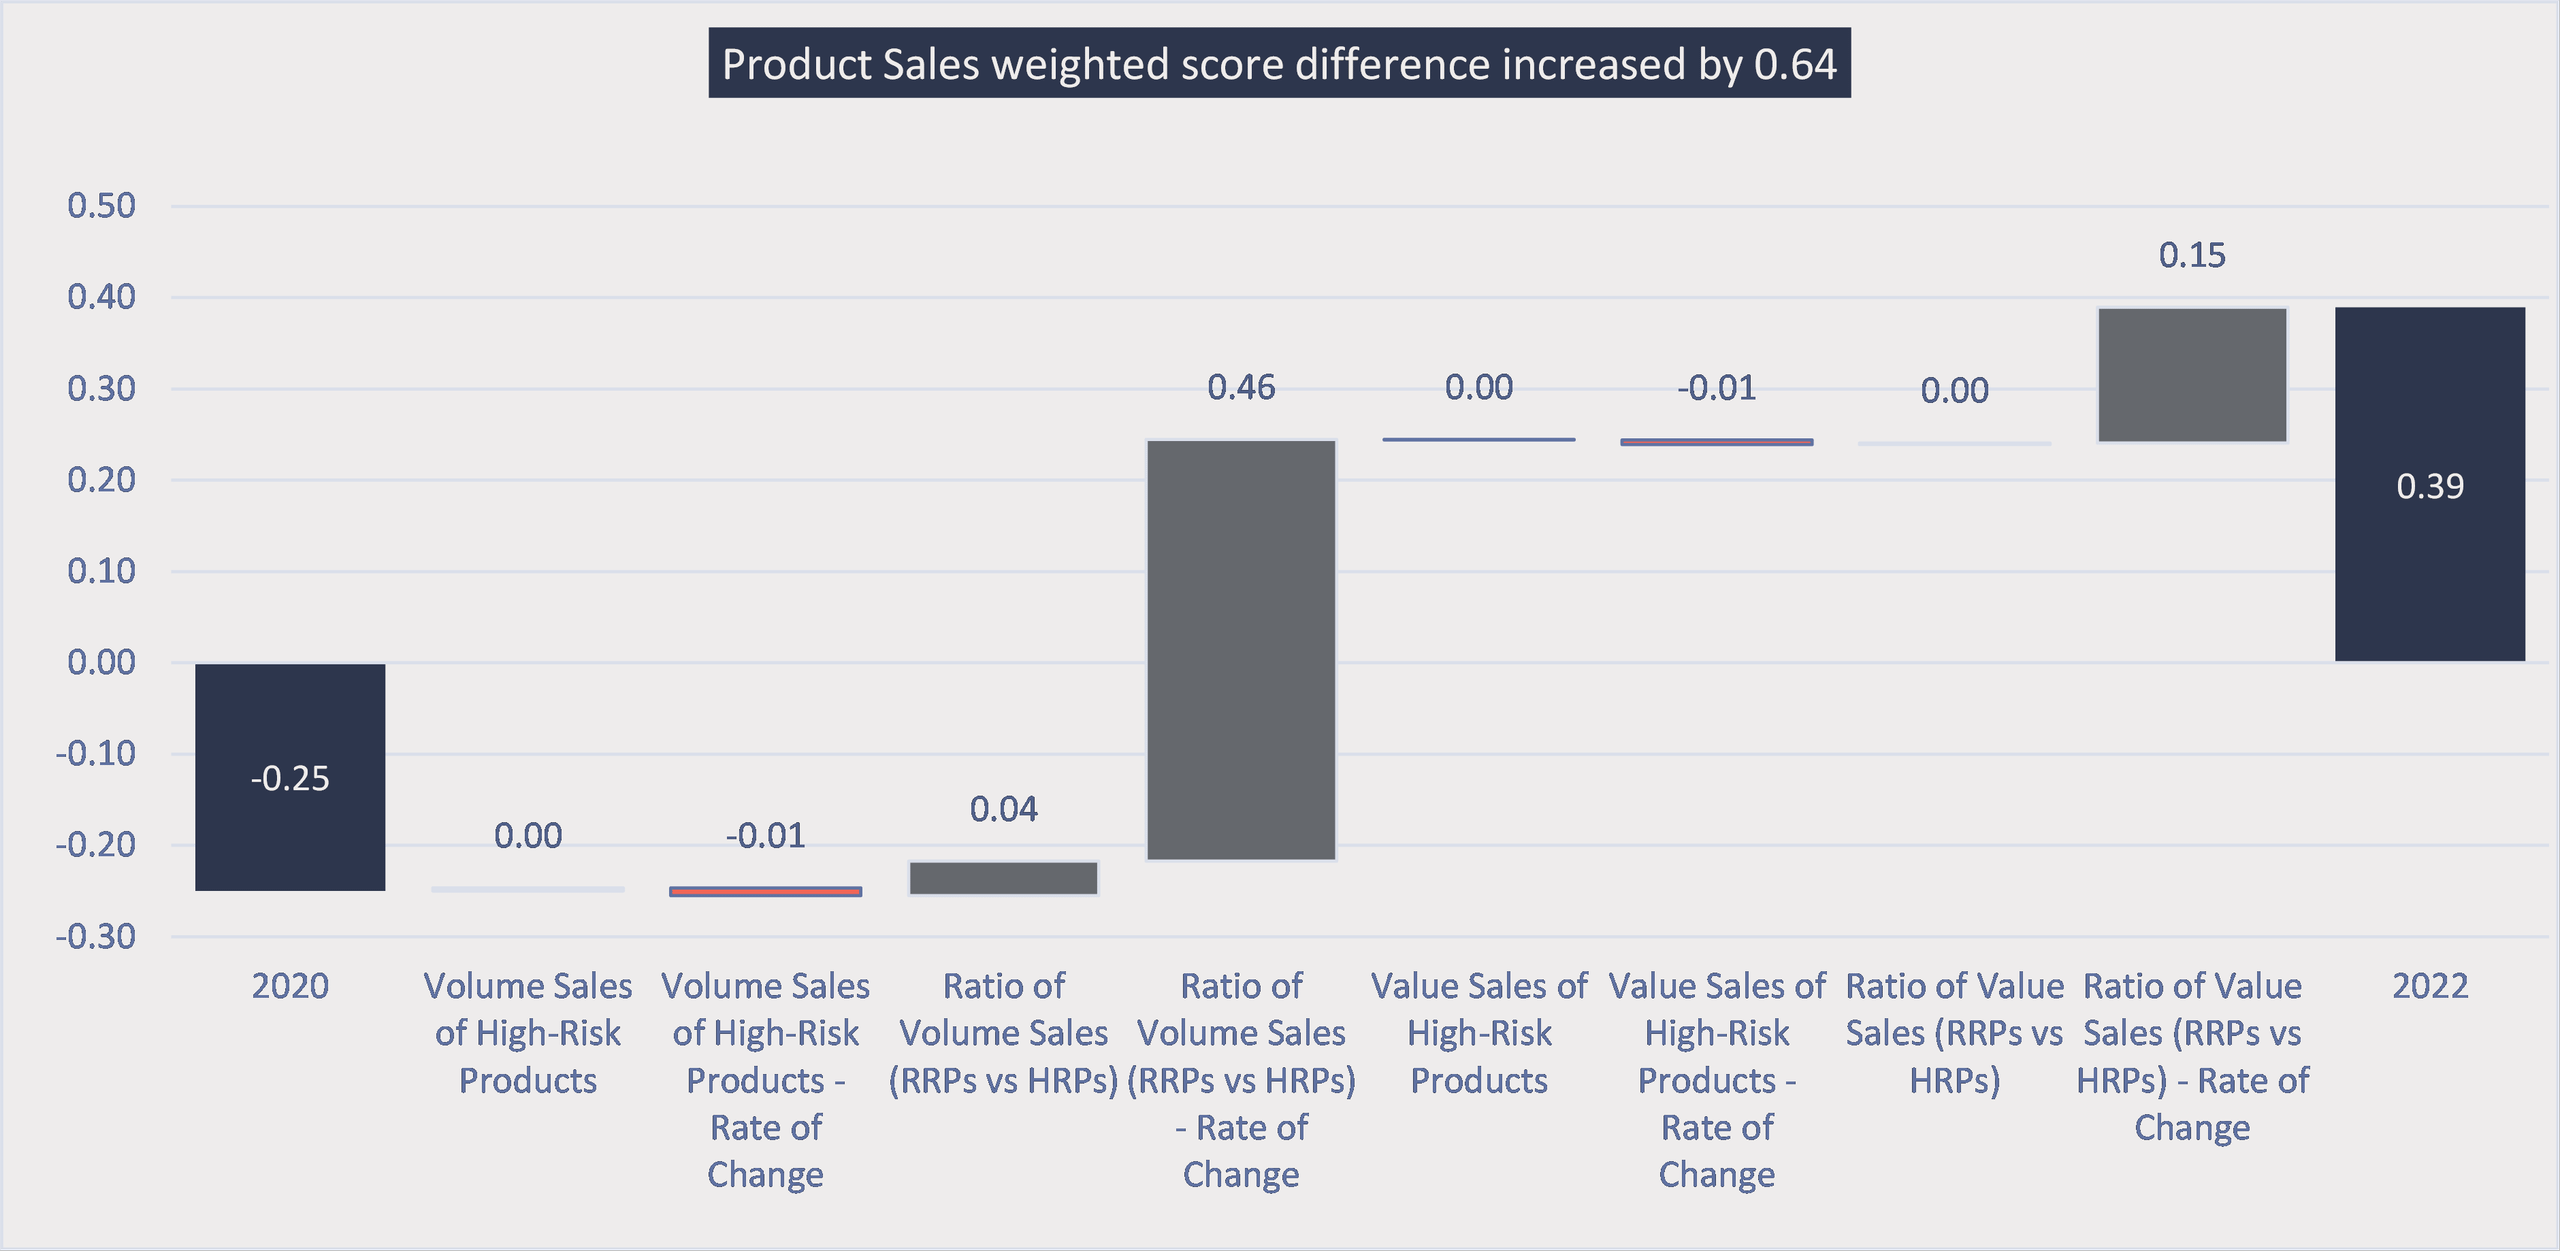
Their Product Sales weighted score difference increased substantially
by 0.64 as Swisher moved ahead of Imperial in the category. The most
significant driver was the rate of change of the RRP/HRP volume ratio.
Indicator contribution to change in Product Sales weighted score difference: Swisher less Imperial Brands Plc
Source: Tobacco Transformation Index, Idwala Research
The Product Sales category
comparison between Imperial and Swisher shows some important dynamics regarding
the calculation of the Index.
- Swisher’s category score benefitted from the first-time inclusion of Rogue nicotine pouch volumes and the low relative risk attached to these products.
- Imperial’s score was negatively affected by a strategic decision by the company to withdraw its closed-system vaping product from Russia and Japan and its heated tobacco product from Japan.
- However, since scoring is relative, even if Imperial did nothing, its category score would likely have declined owing to significantly improved metrics reported by Swisher and other peers, notably Altria.
- Similarly, Swisher’s score likely benefitted from Imperial reporting weaker Product Sales metrics.
How can Imperial get closer to BAT?
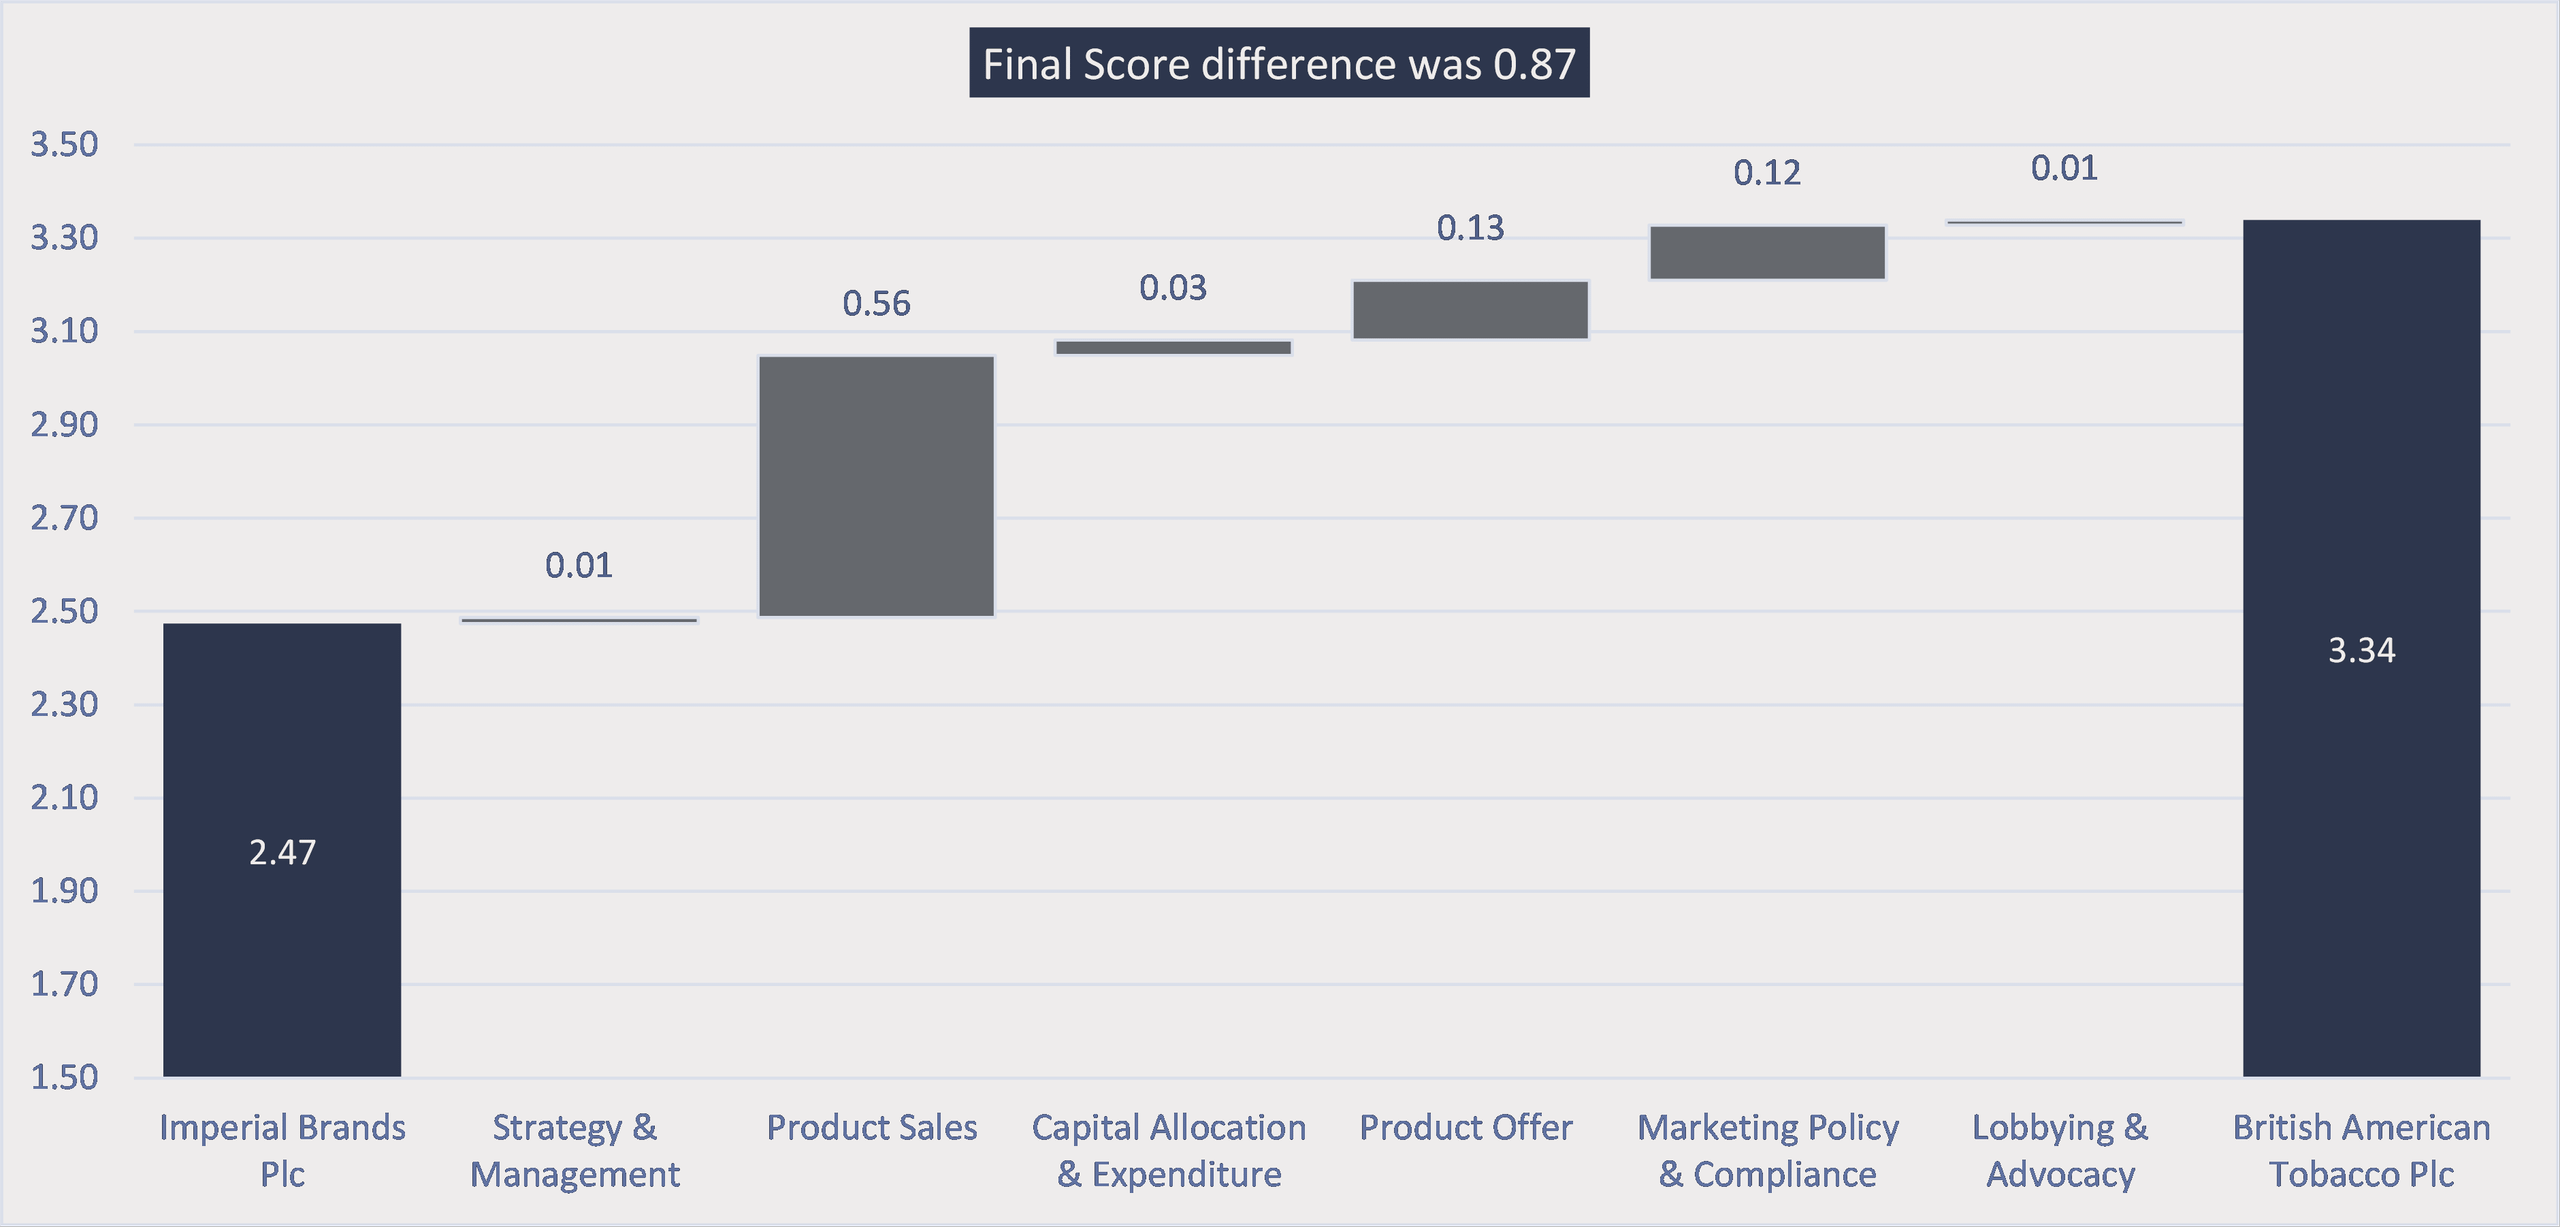
Product Sales, Product Offer and Marketing Policy & Compliance make up most of the 0.87 Final Score difference between Imperial and BAT, with Product Sales the most significant contributor.
Category contribution to Final Score difference: Imperial Brands Plc & British American Tobacco Plc
Source: Tobacco Transformation Index, Idwala Research
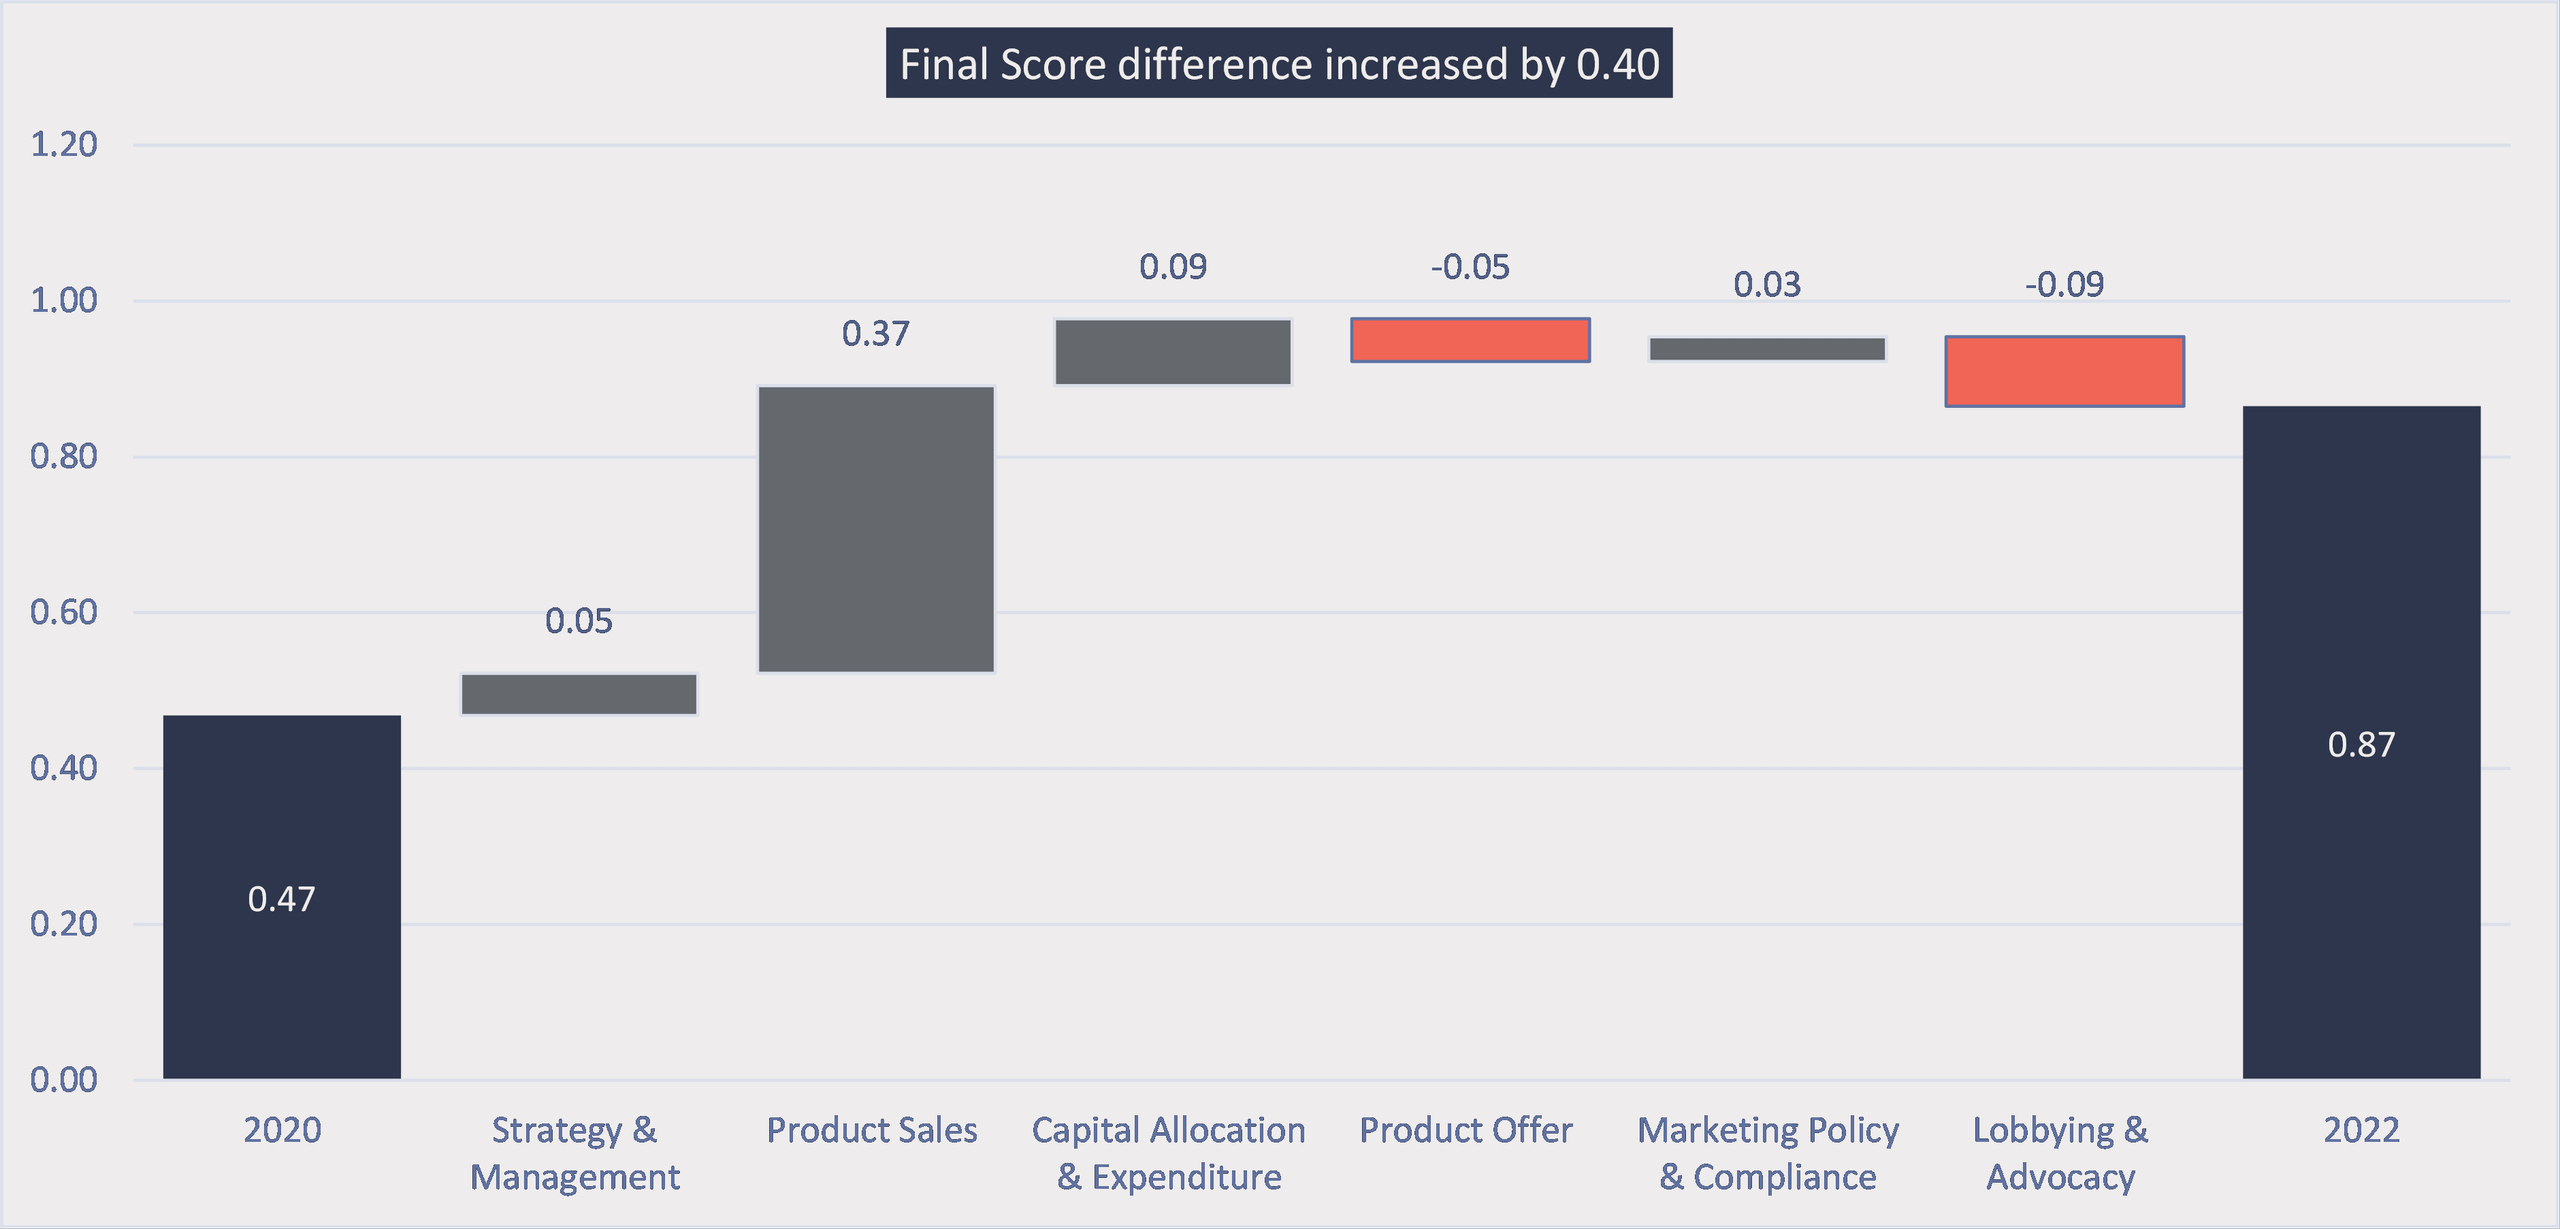
From 2020 to 2022, the Final Score difference between BAT
and Imperial nearly doubled, from 0.47 to 0.87, with Product Sales also
accounting for most of the increase.
Category contribution to change in Final Score difference: British American Tobacco Plc less Imperial Brands Plc
Source: Tobacco Transformation Index, Idwala Research
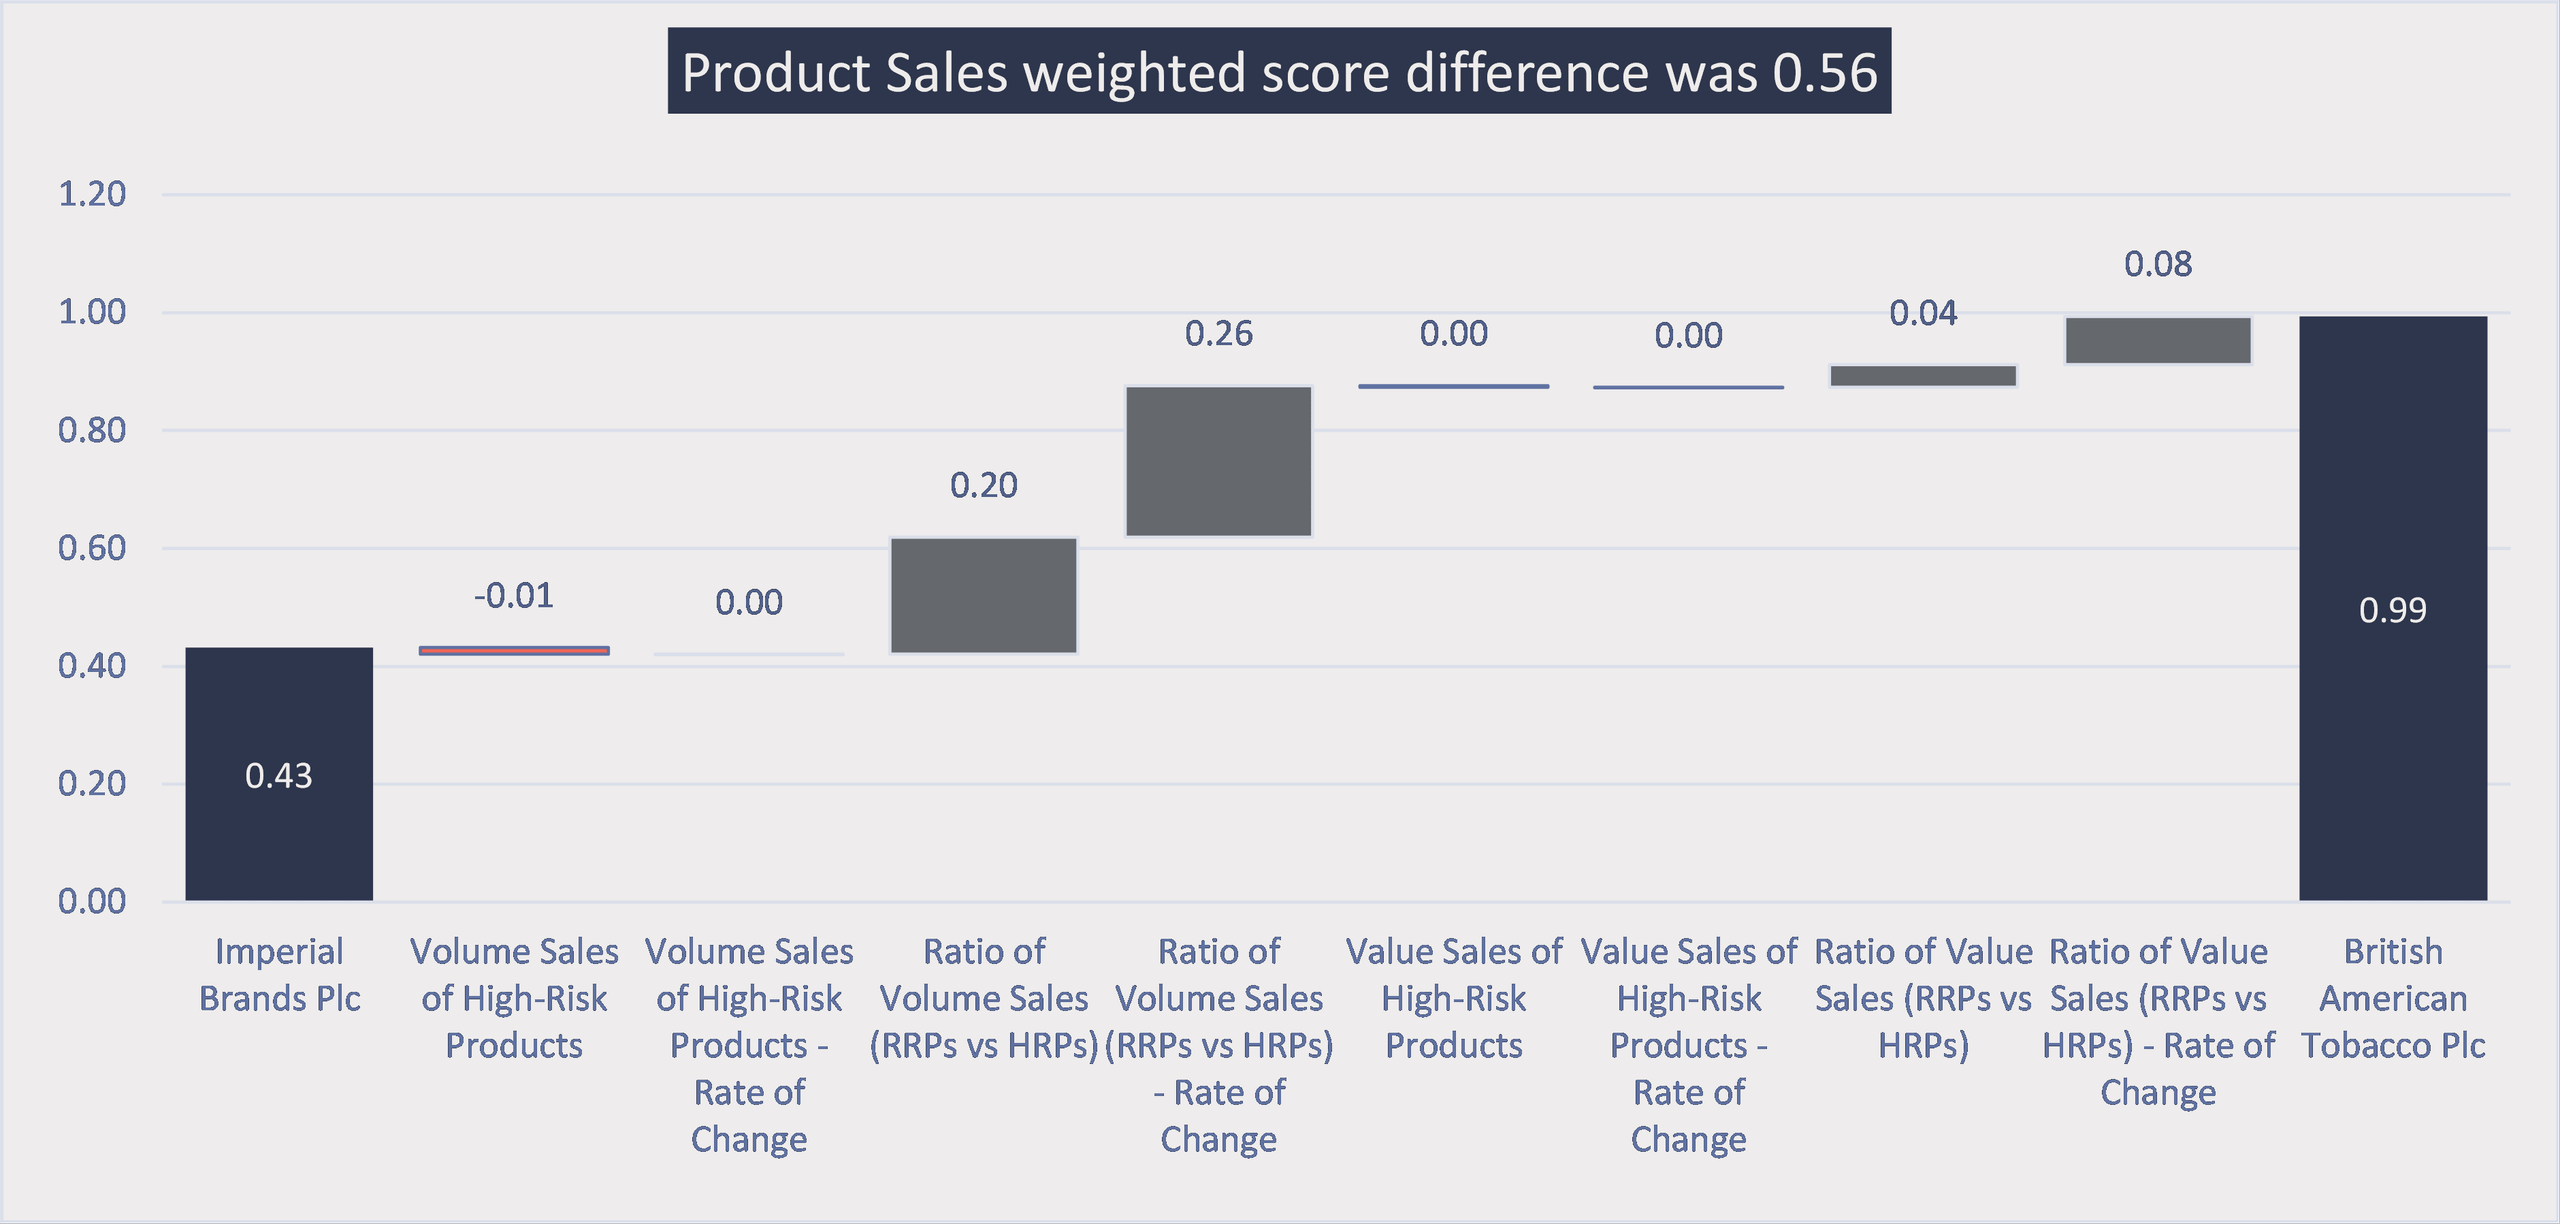
If we narrow the focus to Product Sales, it is clear that the
four RRP/HRP ratio indicators accounted for the 0.56 score difference between
the two companies.
Indicator contribution to Product Sales weighted score difference: Imperial Brands Plc & British American Tobacco Plc
Source: Tobacco Transformation Index, Idwala Research
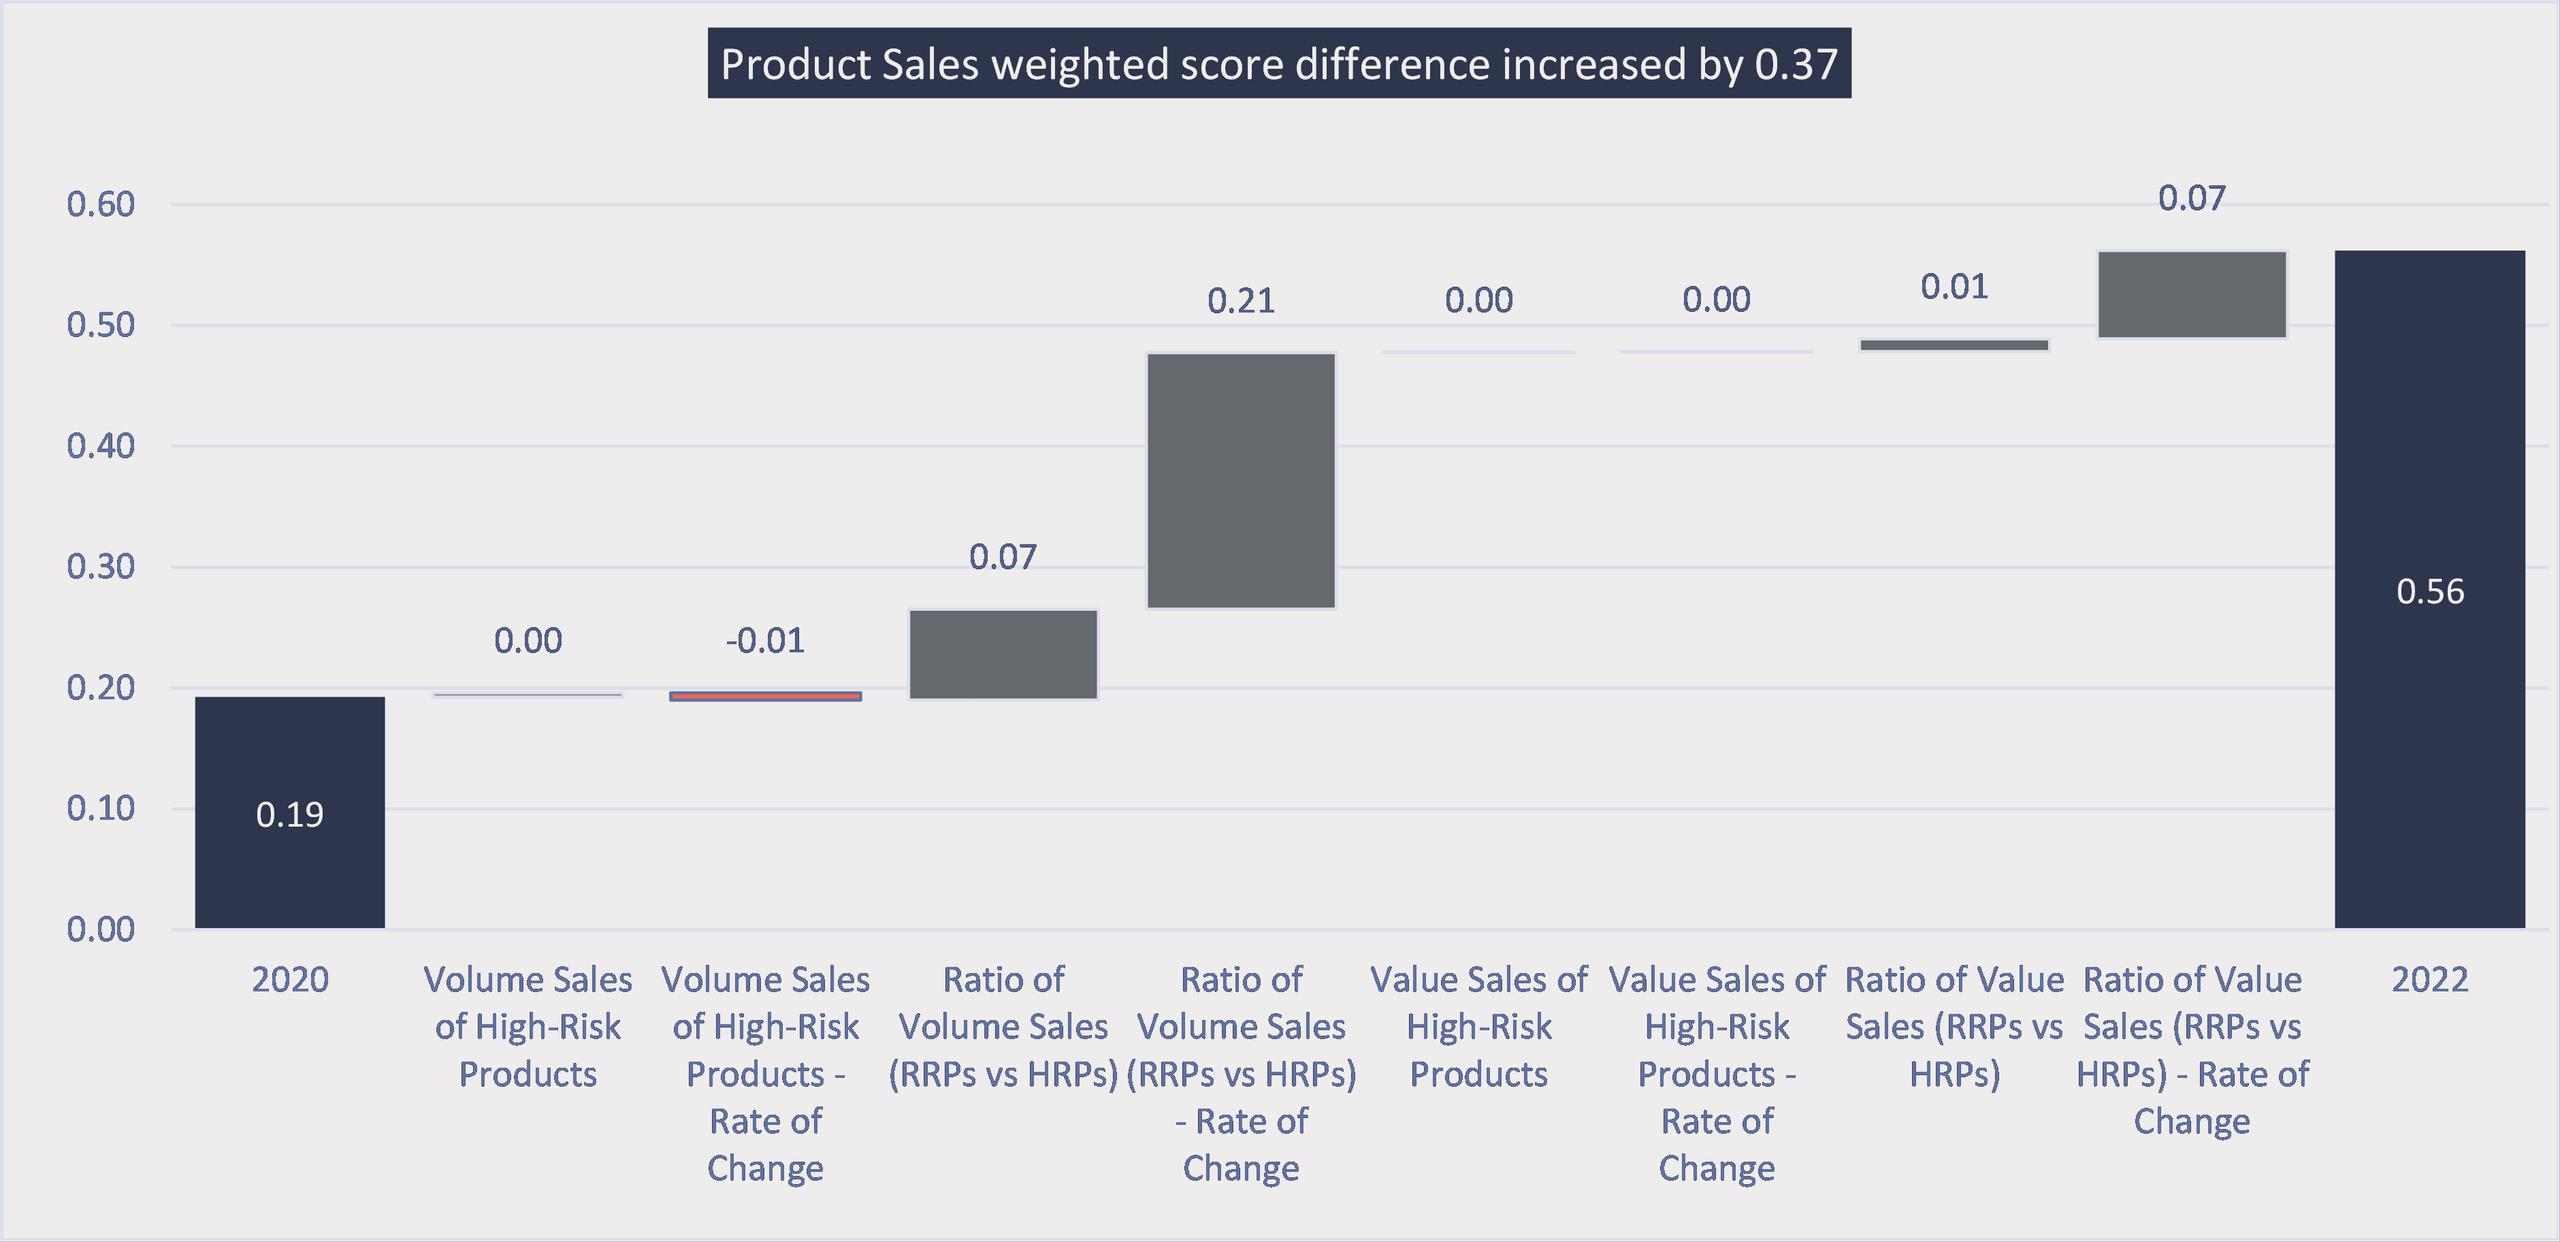
Whilst there was a significant score difference in the
Product Sales category in 2022, this was not the case in the 2020 Index when it
was 0.19.
Indicator contribution to change in Product Sales weighted score difference: British American Tobacco Plc less Imperial Brands Plc
Source: Tobacco Transformation Index, Idwala Research
The 0.37 increase in their weighted score difference again
came from the four RRP/HRP ratio indicators, with more than half (0.21) contributed
by the RRP/HRP volume ratio rate of change indicator. More than 80% of this
indicator’s 2022 0.26 score difference resulted from the increase in its score
difference from 2020.
Imperial’s score in this indicator declined by 0.15, and BAT’s increased by 0.06, with Imperial’s score negatively affected by a combination of its decision to withdraw its closed-system vaping product from Russia and Japan and its heated tobacco product from Japan and improved scores from its Index peers. BAT’s score increase reflects an increase in its RRP volume contribution from 6.6% to 10.0% over the Index review period. For Imperial to improve its score and narrow the gap with peers, it needs to expand its RRP business and grow its contribution at a faster rate than the rest of the Index.
Idwala Research Limited produced these reports and Excel tools pursuant to a professional services agreement with the Foundation for a Smoke-Free World, Inc. The opinions expressed herein are the author’s sole responsibility and under no circumstances shall be regarded as reflecting the positions of the Foundation for a Smoke-Free World, Inc. Pieter Vorster, Managing Director of Idwala Research Limited, served on the Index Technical Committee for the 2022 Tobacco Transformation Index.