A Key Building Block for Harm Reduction
 On 21 September the Foundation for a Smoke-Free World launched the first Tobacco Transformation Index. The biennial Index ranks the top 15 global tobacco companies on their relative progress toward harm reduction. It aims to accelerate tobacco harm reduction by encouraging industry participants to speed up the implementation of measures that will improve their relative ranking. In addition, it seeks to provide investors
with an objective tool for engagement with the industry.
On 21 September the Foundation for a Smoke-Free World launched the first Tobacco Transformation Index. The biennial Index ranks the top 15 global tobacco companies on their relative progress toward harm reduction. It aims to accelerate tobacco harm reduction by encouraging industry participants to speed up the implementation of measures that will improve their relative ranking. In addition, it seeks to provide investors
with an objective tool for engagement with the industry.For the Index to have its desired effect, tobacco companies would need to perceive value from improving their index ranking and, for investors, it needs to provide the tools that enable them to engage more effectively with the industry to bring about change. In time, we believe both could be achieved.
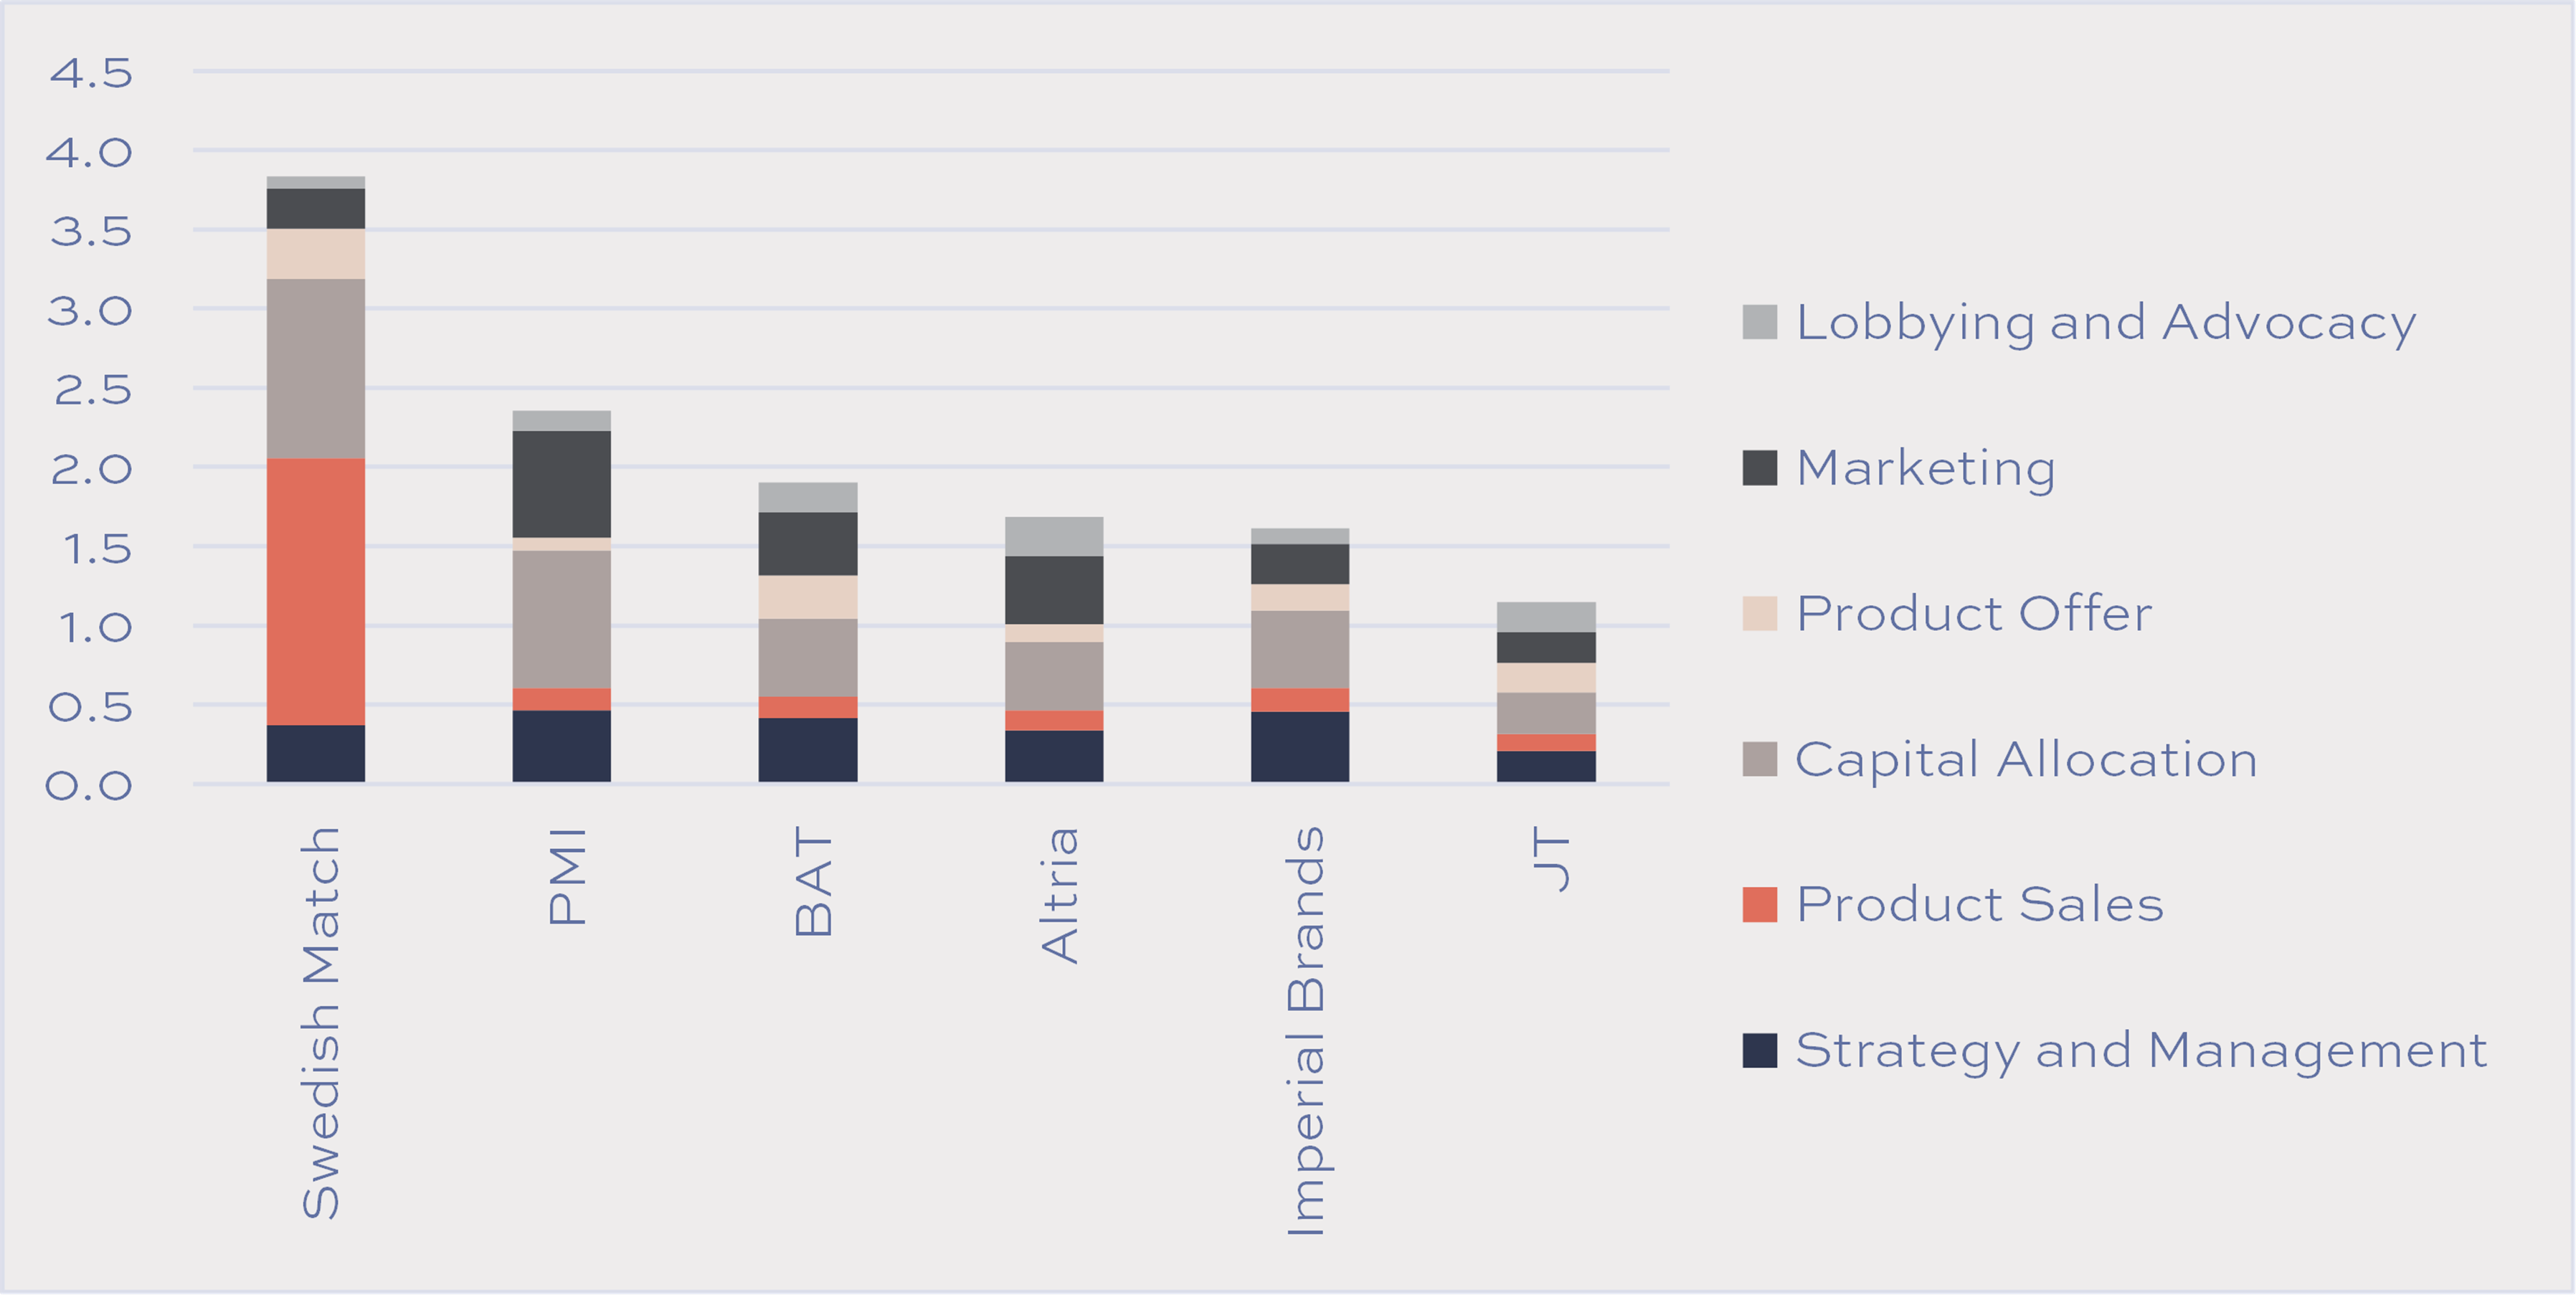
The Tobacco Transformation Index is not perfect, and some things need to be addressed (the weighting assigned to marketing expenditure in particular), but it represents an important milestone on the road to reducing the harm from tobacco.Overall, the relative rankings were not unexpected, with Swedish Match ranking highest, followed by PMI and BAT, and the CNTC ranked at the bottom.
Overall Ranking
Source: Tobacco Transformation Index
The index members are scored on 35 indicators that feed into 11 sub-categories and 6 categories, weighted by how important they are deemed to be in the context of accelerating harm reduction.  Source: Tobacco Transformation Index
For this analysis, we focus on the top six index constituents and the top three categories. Detailed analysis of the remaining index constituents and categories are available on request.
Contribution to Total Scores Source: Tobacco Transformation Index
Product Sales - 35% Index Weighting
In principle, Product Sales rightly have the highest weighting in the Index since it represents actual results, rather than intentions. Still, some anomalies are worth pointing out. Not surprisingly, Swedish Match scores the highest in the Product Sales category by some margin, with the ratio of reduced-risk product v. high-risk product sales and the rate of change of this ratio accounting for the bulk of its score. Surprisingly, US Moist Snuff was included in the high, rather than low-risk category, but this was based on a systematic review of and data from 320 previous scientific studies to derive a relative risk score for each product.
In the chart below, we show only the volume sub-category of the Product Sales Score since it carries an 80% category weight, compared with a 20% weighting for value.
Contribution to Product Sales Scores - Volume component Source: Tobacco Transformation Index
The remaining two indicators that make up the volume sub-category, namely high-risk product volumes and their rate of change leave room for index anomalies and are potentially at odds with the fiduciary duties of company management and directors. In fairness, these two indicators account for only 10% of the sub-category weighting.
We regard the central anomalies as the following:
- By merely having a larger geographical footprint and higher market share than its peers, a tobacco company is penalised on this measure.
- Companies who have large exposures to mature, declining combustible markets, benefit from this measure, regardless of their reduced-risk performance.
- Those who cede combustible market share to their peers, also benefit from this measure, even though this contributes neither to industry transformation nor harm reduction.
Capital Allocation - 25% Index Weighting
Capital Allocation carries the second-highest weighting in the Index, and we would have favoured a closer alignment between its contribution and that of Marketing, if not a lower weighting.Swedish Match once again comes out top, followed by PMI and BAT, with the main difference between Swedish Match and PMI being the ratio of R&D expenditure on reduced-risk v. high-risk products.
Contribution to Capital Allocation Scores Source: Tobacco Transformation Index
Marketing - 15% Index Weighting
It is worth analysing the Marketing component of the Index in further detail. At the category level, it arguably needs to carry a higher index weighting than 15%, especially when considered against the 25% afforded to Capital Allocation.Marketing expenditure and brand building is the lifeblood of the consumer goods industry, and brands are its single largest asset category, albeit not one that is recorded on the balance sheet. Therefore, it stands to reason that marketing, rather than capital expenditure, will have a far more pronounced impact on the trajectory of the business.
Sadly, Marketing Expenditure only accounts for 15% of the overall Marketing score, which, in itself, only contributes 15% to the overall score of each Index participant. This means that Marketing Expenditure makes up only 2.25% of the overall score.
Contribution to Marketing Score Source: Tobacco Transformation Index
Disclosure of policy violations appears to carry a disproportionately high weighting within the Marketing category - a total of 57.5%. Whilst we appreciate the importance of violation disclosures, this seems somewhat disproportionate.
PMI scores highest in the Marketing category, substantially driven by Marketing Compliance, which has only one performance indicator - Disclosure of Violations.

Source: Tobacco Transformation Index

 Source: Tobacco Transformation Index