Simplifying Analysis of the 2022 Tobacco Transformation Index

We have published a set of in-depth reports and Excel tools to help simplify analysis of the Tobacco Transformation Index.
The two reports and Excel tools aim to help investors and companies navigate the large dataset underlying the 2022 Tobacco Transformation Index to gain insight at a granular level into:
- why a company attained the score and ranking that it did,
- how these changed from the 2020 Index publication,
- and where the most feasible opportunities for score and ranking improvement and, by implication, transformation are.
A clearer understanding of the underlying drivers of the Index rankings and scores should lay the groundwork for more robust engagement between companies and investors on transformation based on objective data. Furthermore, increased, and well-informed engagement with the Index will ultimately improve its utility for all stakeholders and help accelerate Tobacco Transformation and its underlying goal, Tobacco Harm Reduction.
Why should either investors or companies care?
The interests of the business and investor communities may not always, or even often, be aligned with an altruistic social responsibility agenda, but in tobacco, a solid case can be made for transformation.
The adverse health impact of harmful tobacco products has discouraged consumers from using them and invited a strong and ongoing regulatory response aimed at significantly curtailing consumption. Industry participants have faced declining volumes for some time and are increasingly shunned by the investor community on ESG grounds. Remaining investors are valuing combustible tobacco as an industry in terminal decline.
The significant growth of reduced-risk tobacco products (RRPs) over the past decade has introduced both a disruptive threat and a growth opportunity to the industry. Those who invest in it have increasingly differentiated industry participants based on the extent to which they have introduced RRPs into their businesses. The chart below shows the P/E valuation multiples of the seven companies covered in these reports against the contribution from RRPs to 2021 sales revenues. There appears to be a clear incentive for tobacco companies to embrace RRPs and transformation and for investors to engage with and encourage the companies they are invested in to accelerate the process.
12-month forward P/E v. RRP contribution to 2021 sales value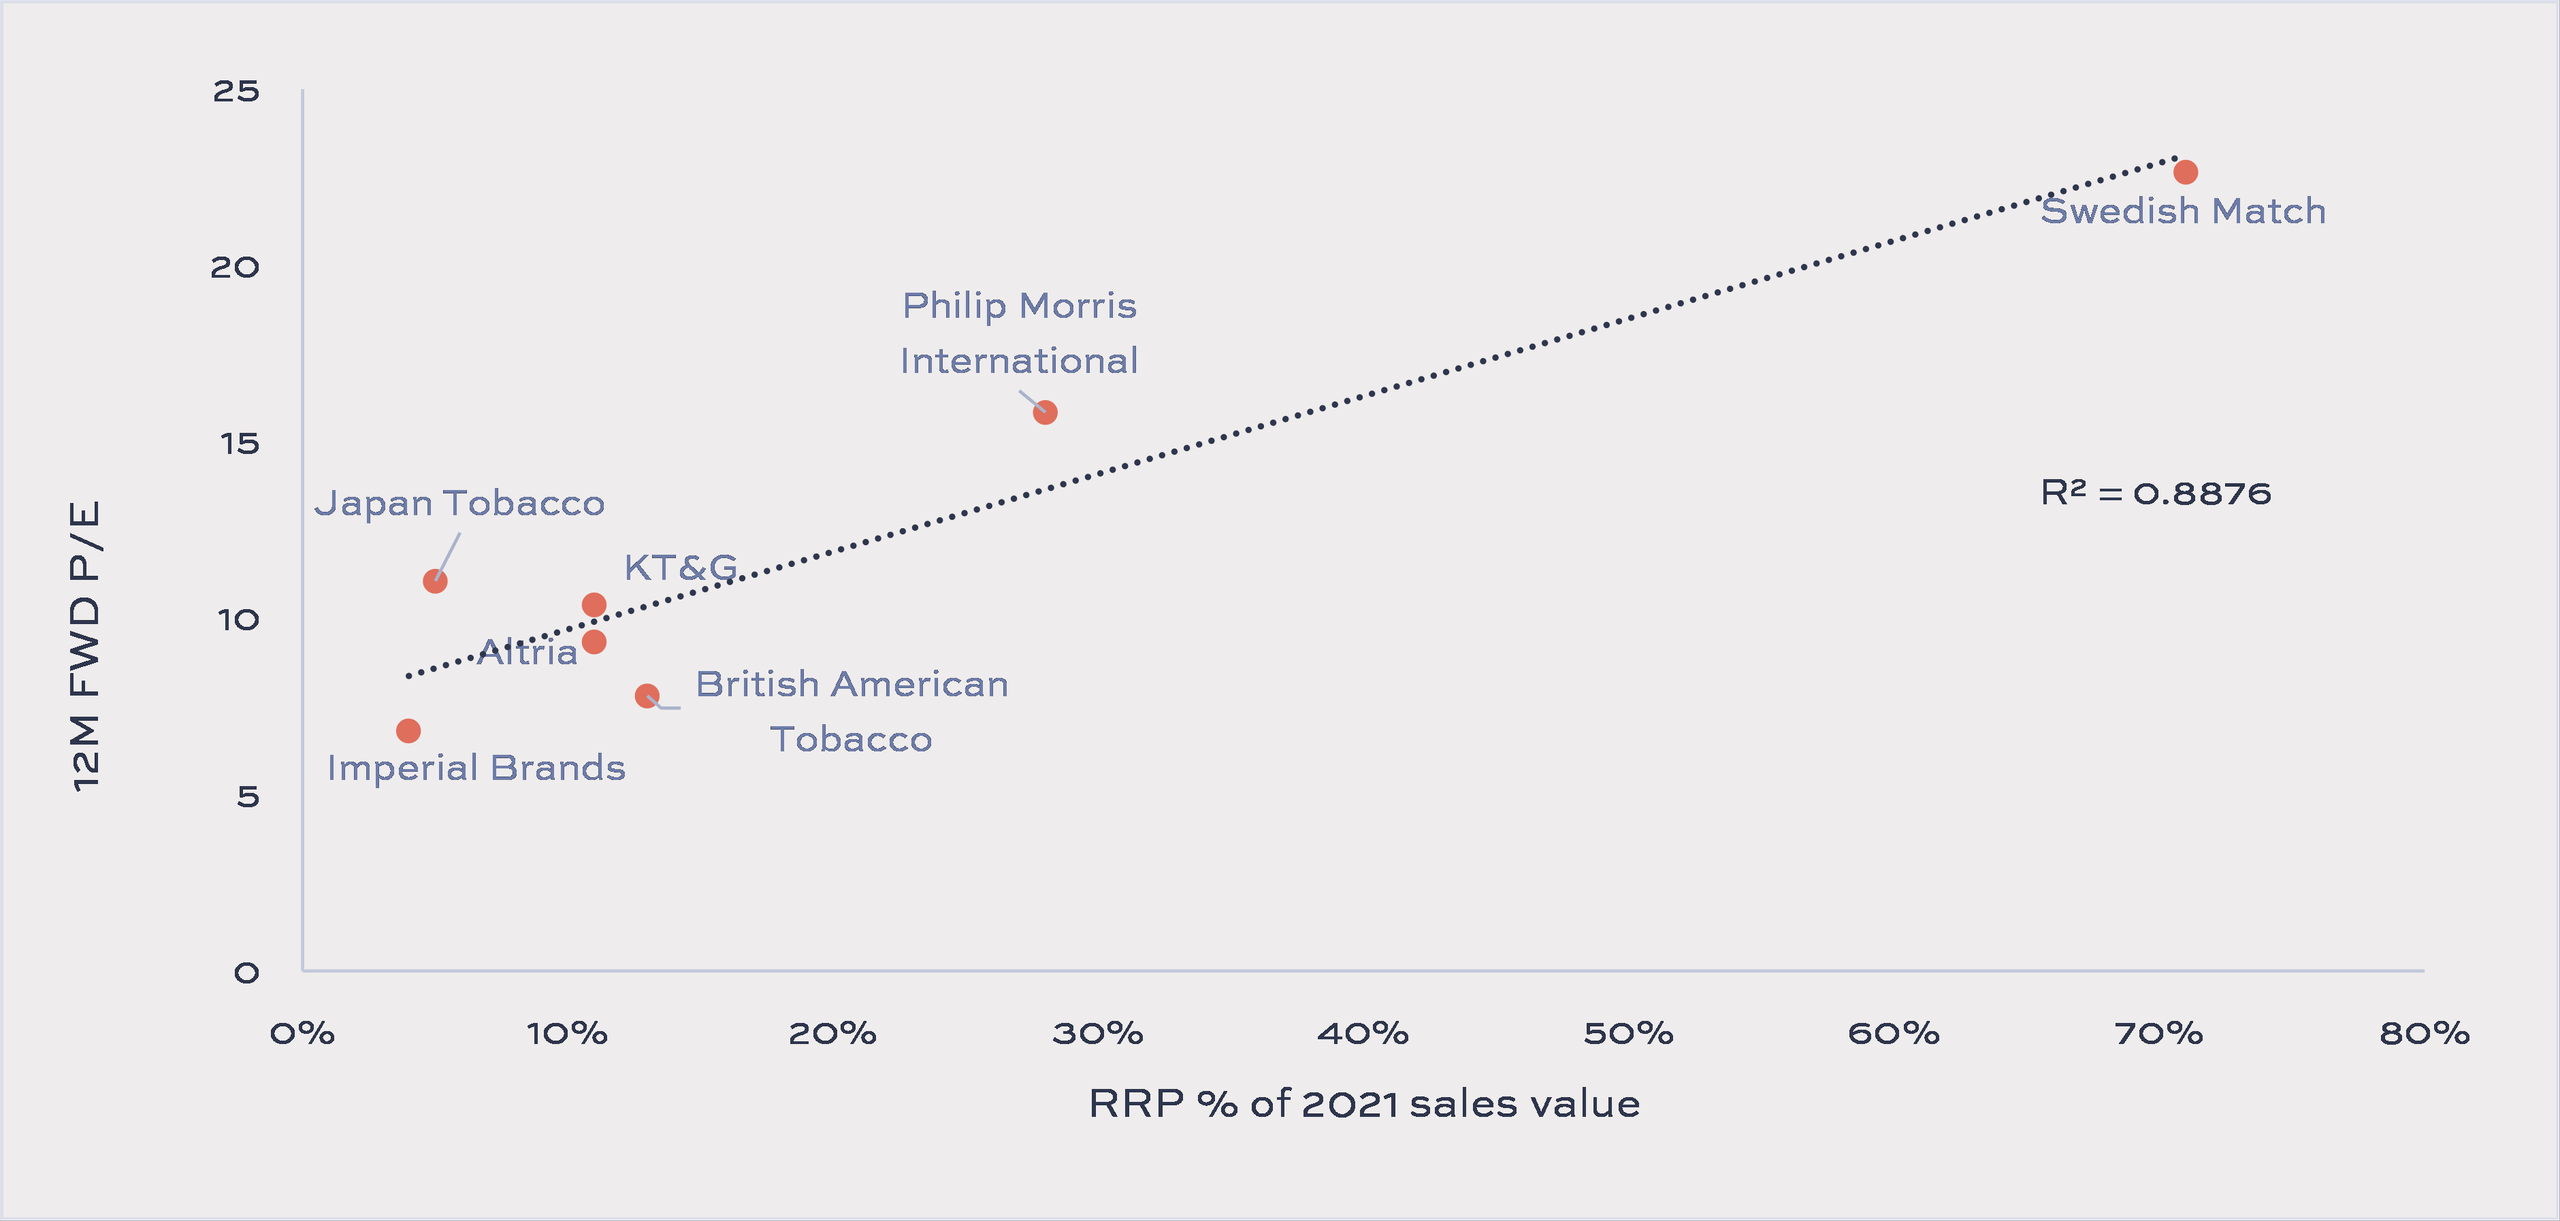 Source: Tobacco Transformation Index, Idwala Research. Priced as of close 10 February 2023. Swedish Match share price and estimates as of 30 December 2022

Report Structure
The first report, Underlying Score and Score Change Drivers of the Top Seven, analyses the underlying score drivers of the top seven ranked companies that make up the top two behavioural clusters of the 2022 Tobacco Transformation Index and how these changed from 2020 to 2022. We look at the following:
- The category contributions to each company’s Final Score, change in Final Score and rankings, and
- The indicator contributions to weighted scores, score changes and rankings for each category and company.
In the second report, Peer Comparison of Top-Ranked Companies, we make company-to-company comparisons of the three Index Companies remaining in the “Strategic Commitment & Execution” cluster of the Index following PMI’s acquisition of Swedish Match. We specifically look at the following:
- Their relative rankings and ranking changes by category and indicator,
- The category contributions to their Final Score differences and change in Final Score differences, and
- The indicator contributions to their weighted score differences in each category and the change in those differences.
Excel Tools and Application
Our Company Comparison Excel Tool enables users to compare any two Index Companies side-by-side on Category and Indicator scores and rankings as well as sales and capital allocation metrics.
It also shows:
- The respective Category Score contributions to the change in their Final Scores and Indicator Score contributions to their Category Score changes,
- Category and Indicator contributions to the score difference,
- and the change in the score difference between the two companies.
For example, the Final Score difference between Altria and BAT was 0.16. Lobbying & Advocacy made the most significant contribution (0.13), followed by Capital Allocation & Expenditure at 0.10 and Product sales at 0.05. Strategy & Management, where BAT’s score was higher than Altria’s, reduced their Final Score difference by 0.09.
Category contribution to Final Score difference: British American Tobacco Plc & Altria Group Inc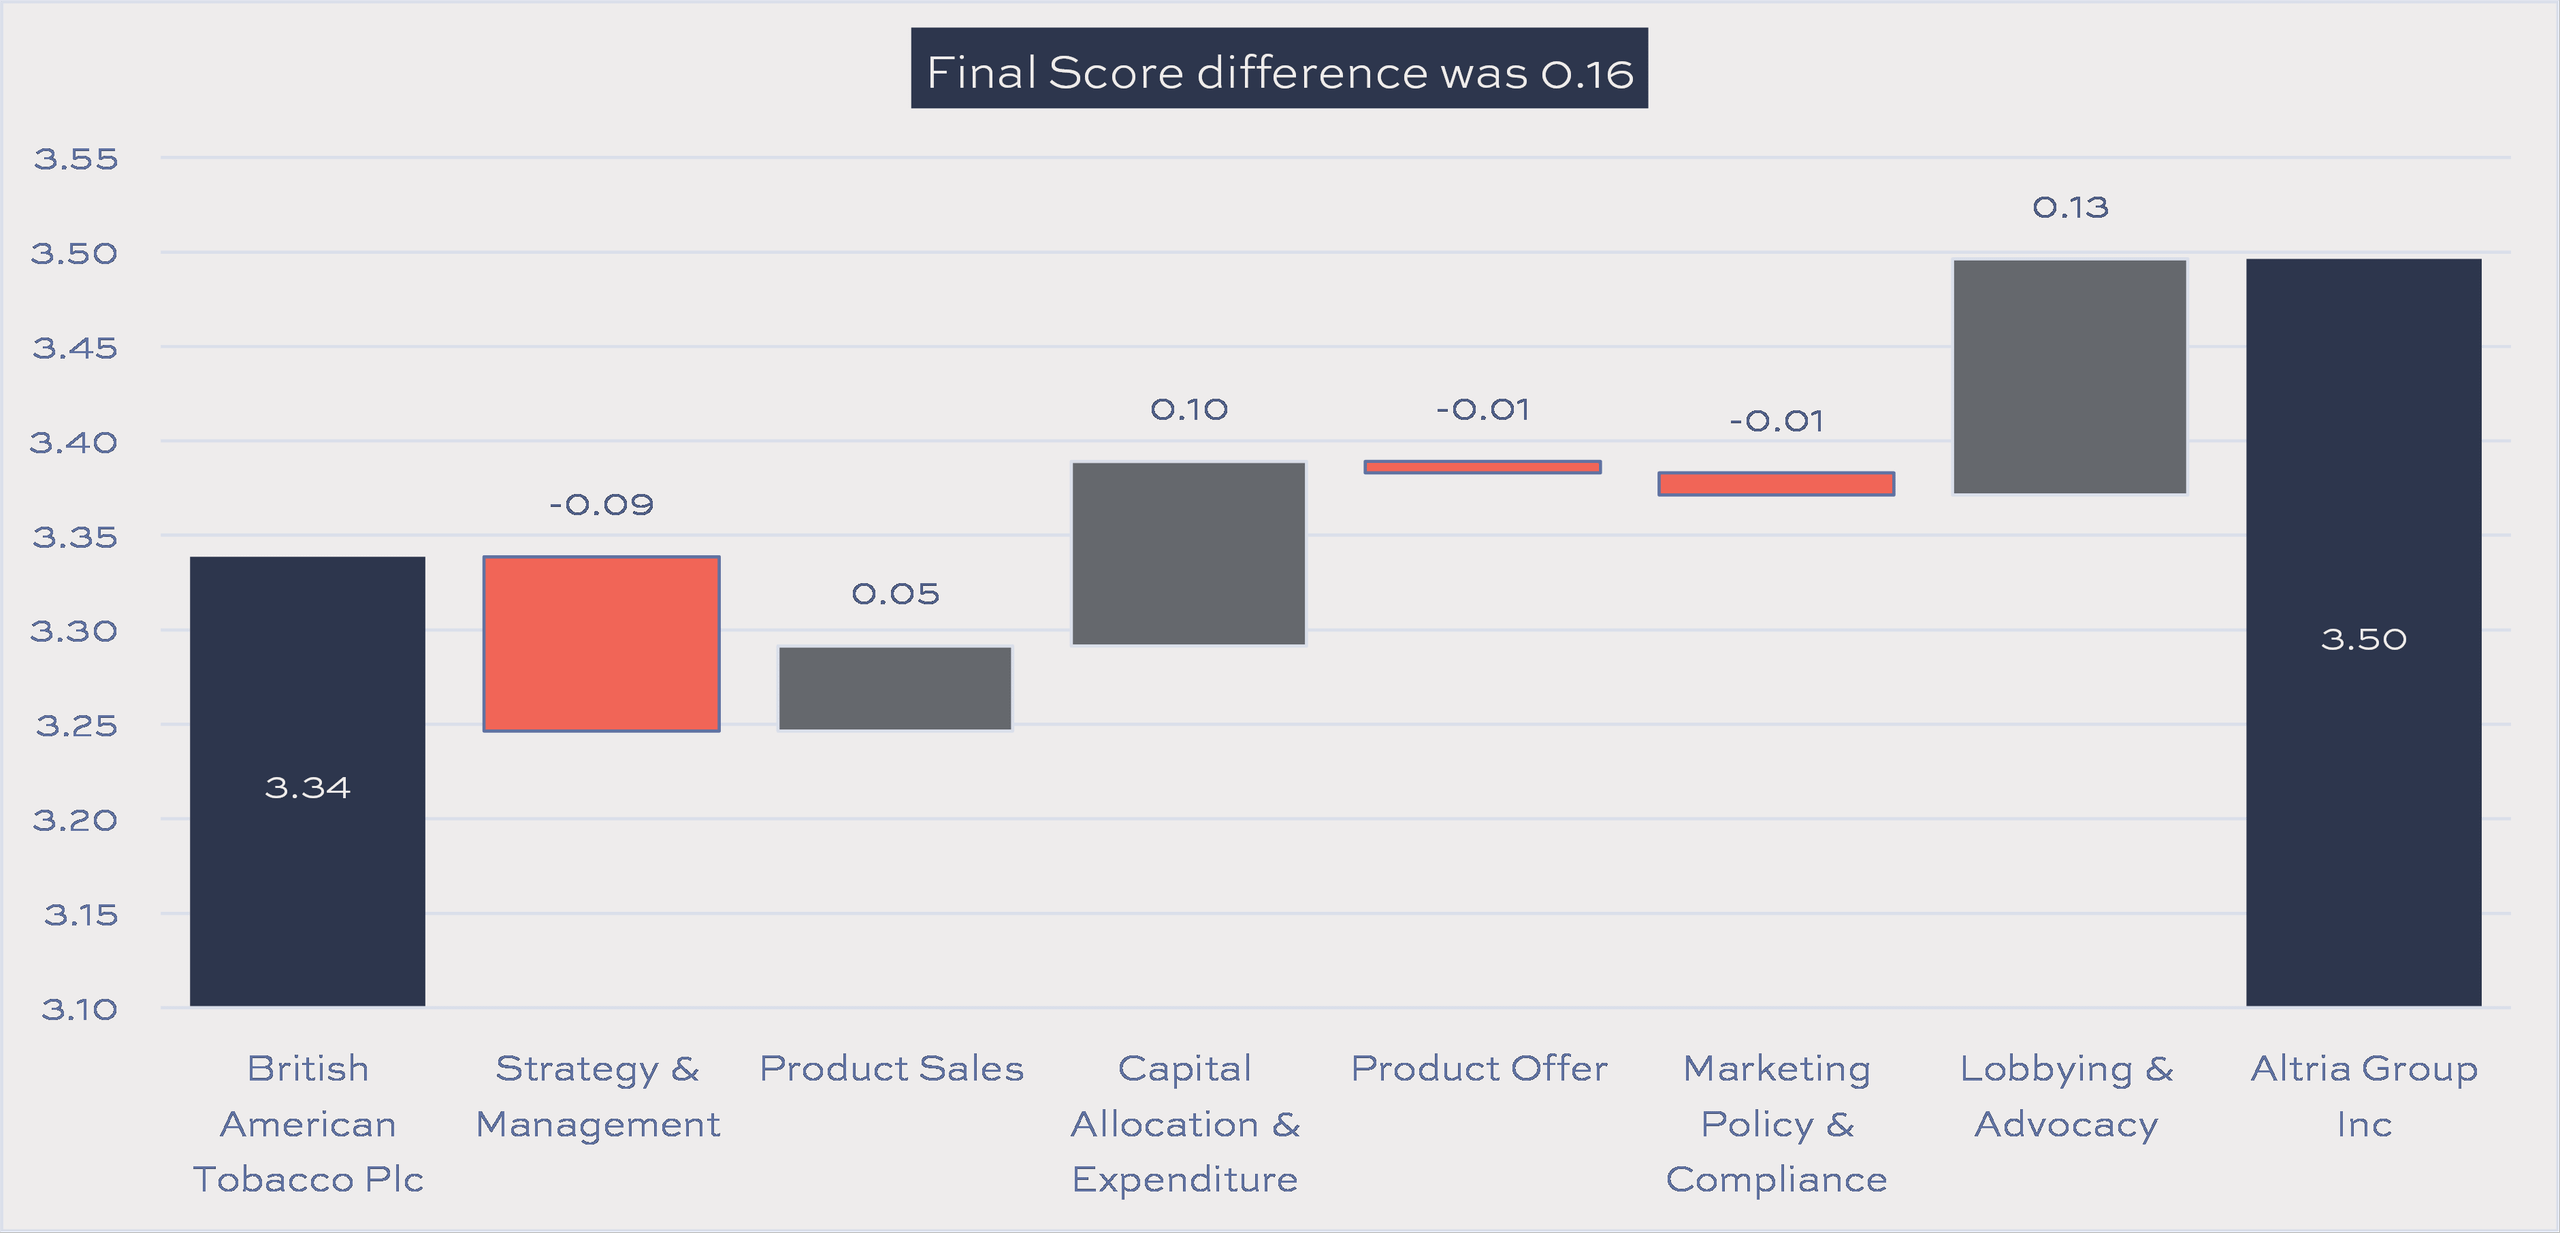 Source: Tobacco Transformation Index, Idwala Research

In 2020, BAT’s Final Score was 0.05 higher than Altria, whereas in 2022, Altria’s score was 0.16 higher than BAT’s. Relative to BAT, Altria’s weighted scores increased the most in Product Sales and Capital Allocation & Expenditure (0.12 each), Followed by Lobbying & Advocacy at 0.09. These gains were partly offset by declines in Marketing Policy & Compliance (0.08) and Strategy & Management (0.05). In the Product Offer category, their score difference remained unchanged.
Category contribution to change in Final Score difference: Altria less BAT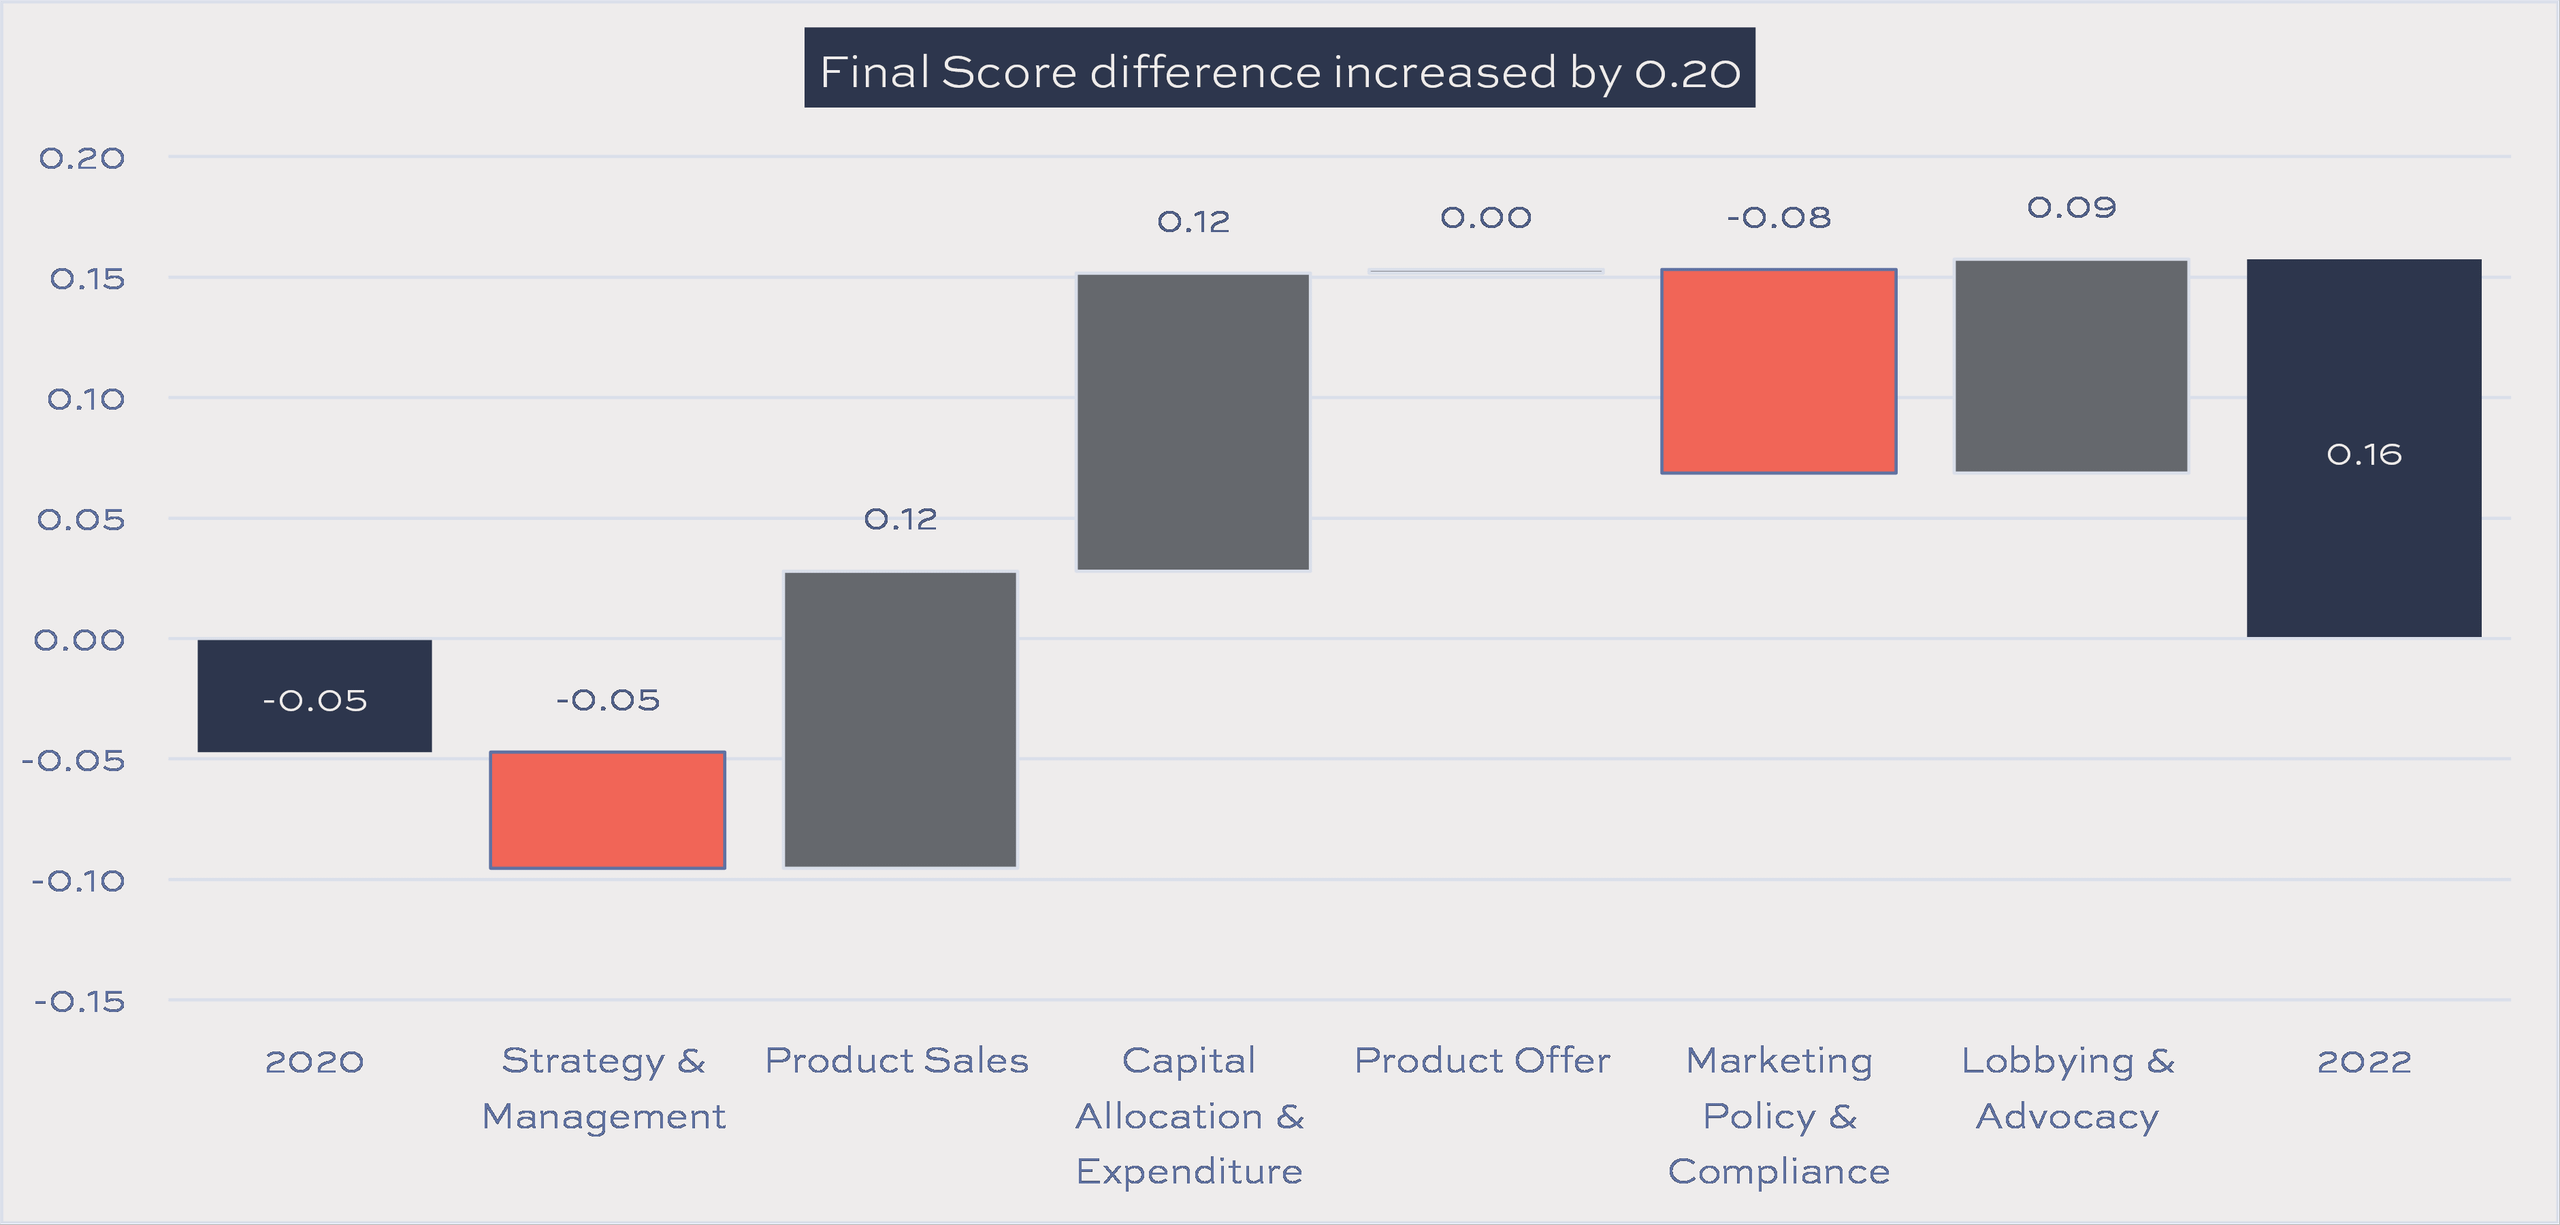 Source: Tobacco Transformation Index, Idwala Research

In the Product Sales Category, for example, the most important driver of the 0.05 weighted score difference between Altria and BAT was Ratio of Volume Sales (RRPs vs HRPs), contributing 0.06.
Indicator contribution to Product Sales weighted score difference: BAT & Altria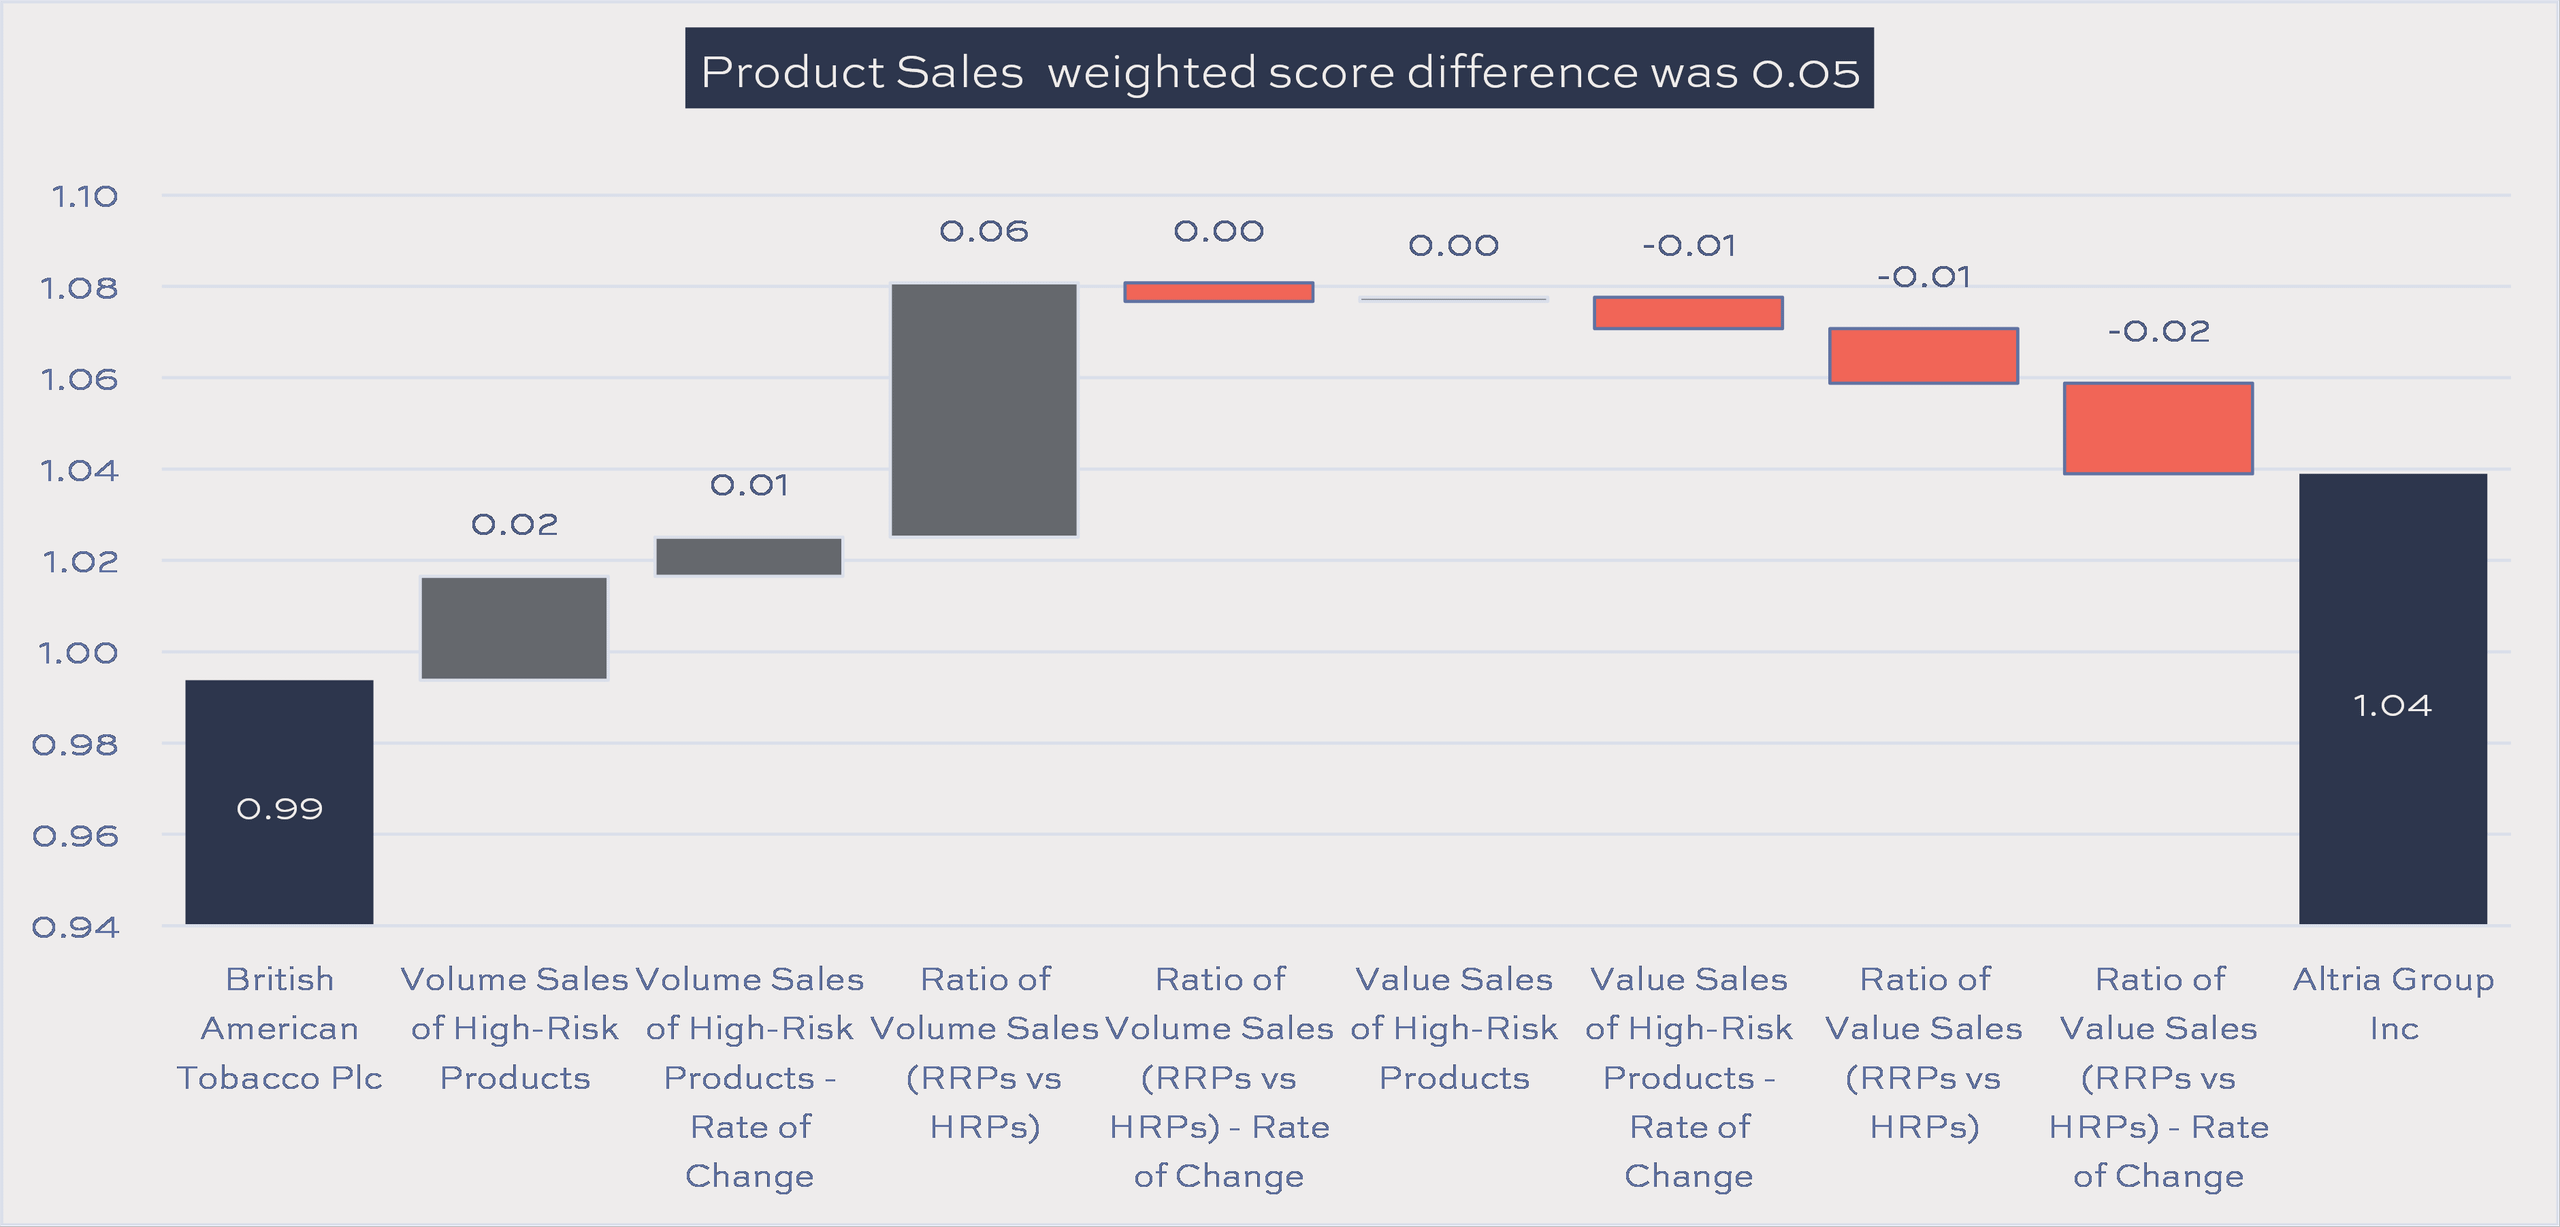 Source: Tobacco Transformation Index, Idwala Research

In 2020, BAT’s Product Sales weighted score was 0.08 higher than Altria’s, but this reversed in 2022, with Altria’s 0.05 higher than BAT’s. This reversal was due to Altria’s scores in both the volume and value RRP/HRP ratio rate of change indicators increasing by more than BAT’s (0.12 and 0.06). These increases were partly offset by BAT gaining more than Altria in the RRP/HRP ratios and BAT’s value of HRPs rate of change indicator score increasing.
Contribution to change in Product Sales weighted score difference: Altria less BAT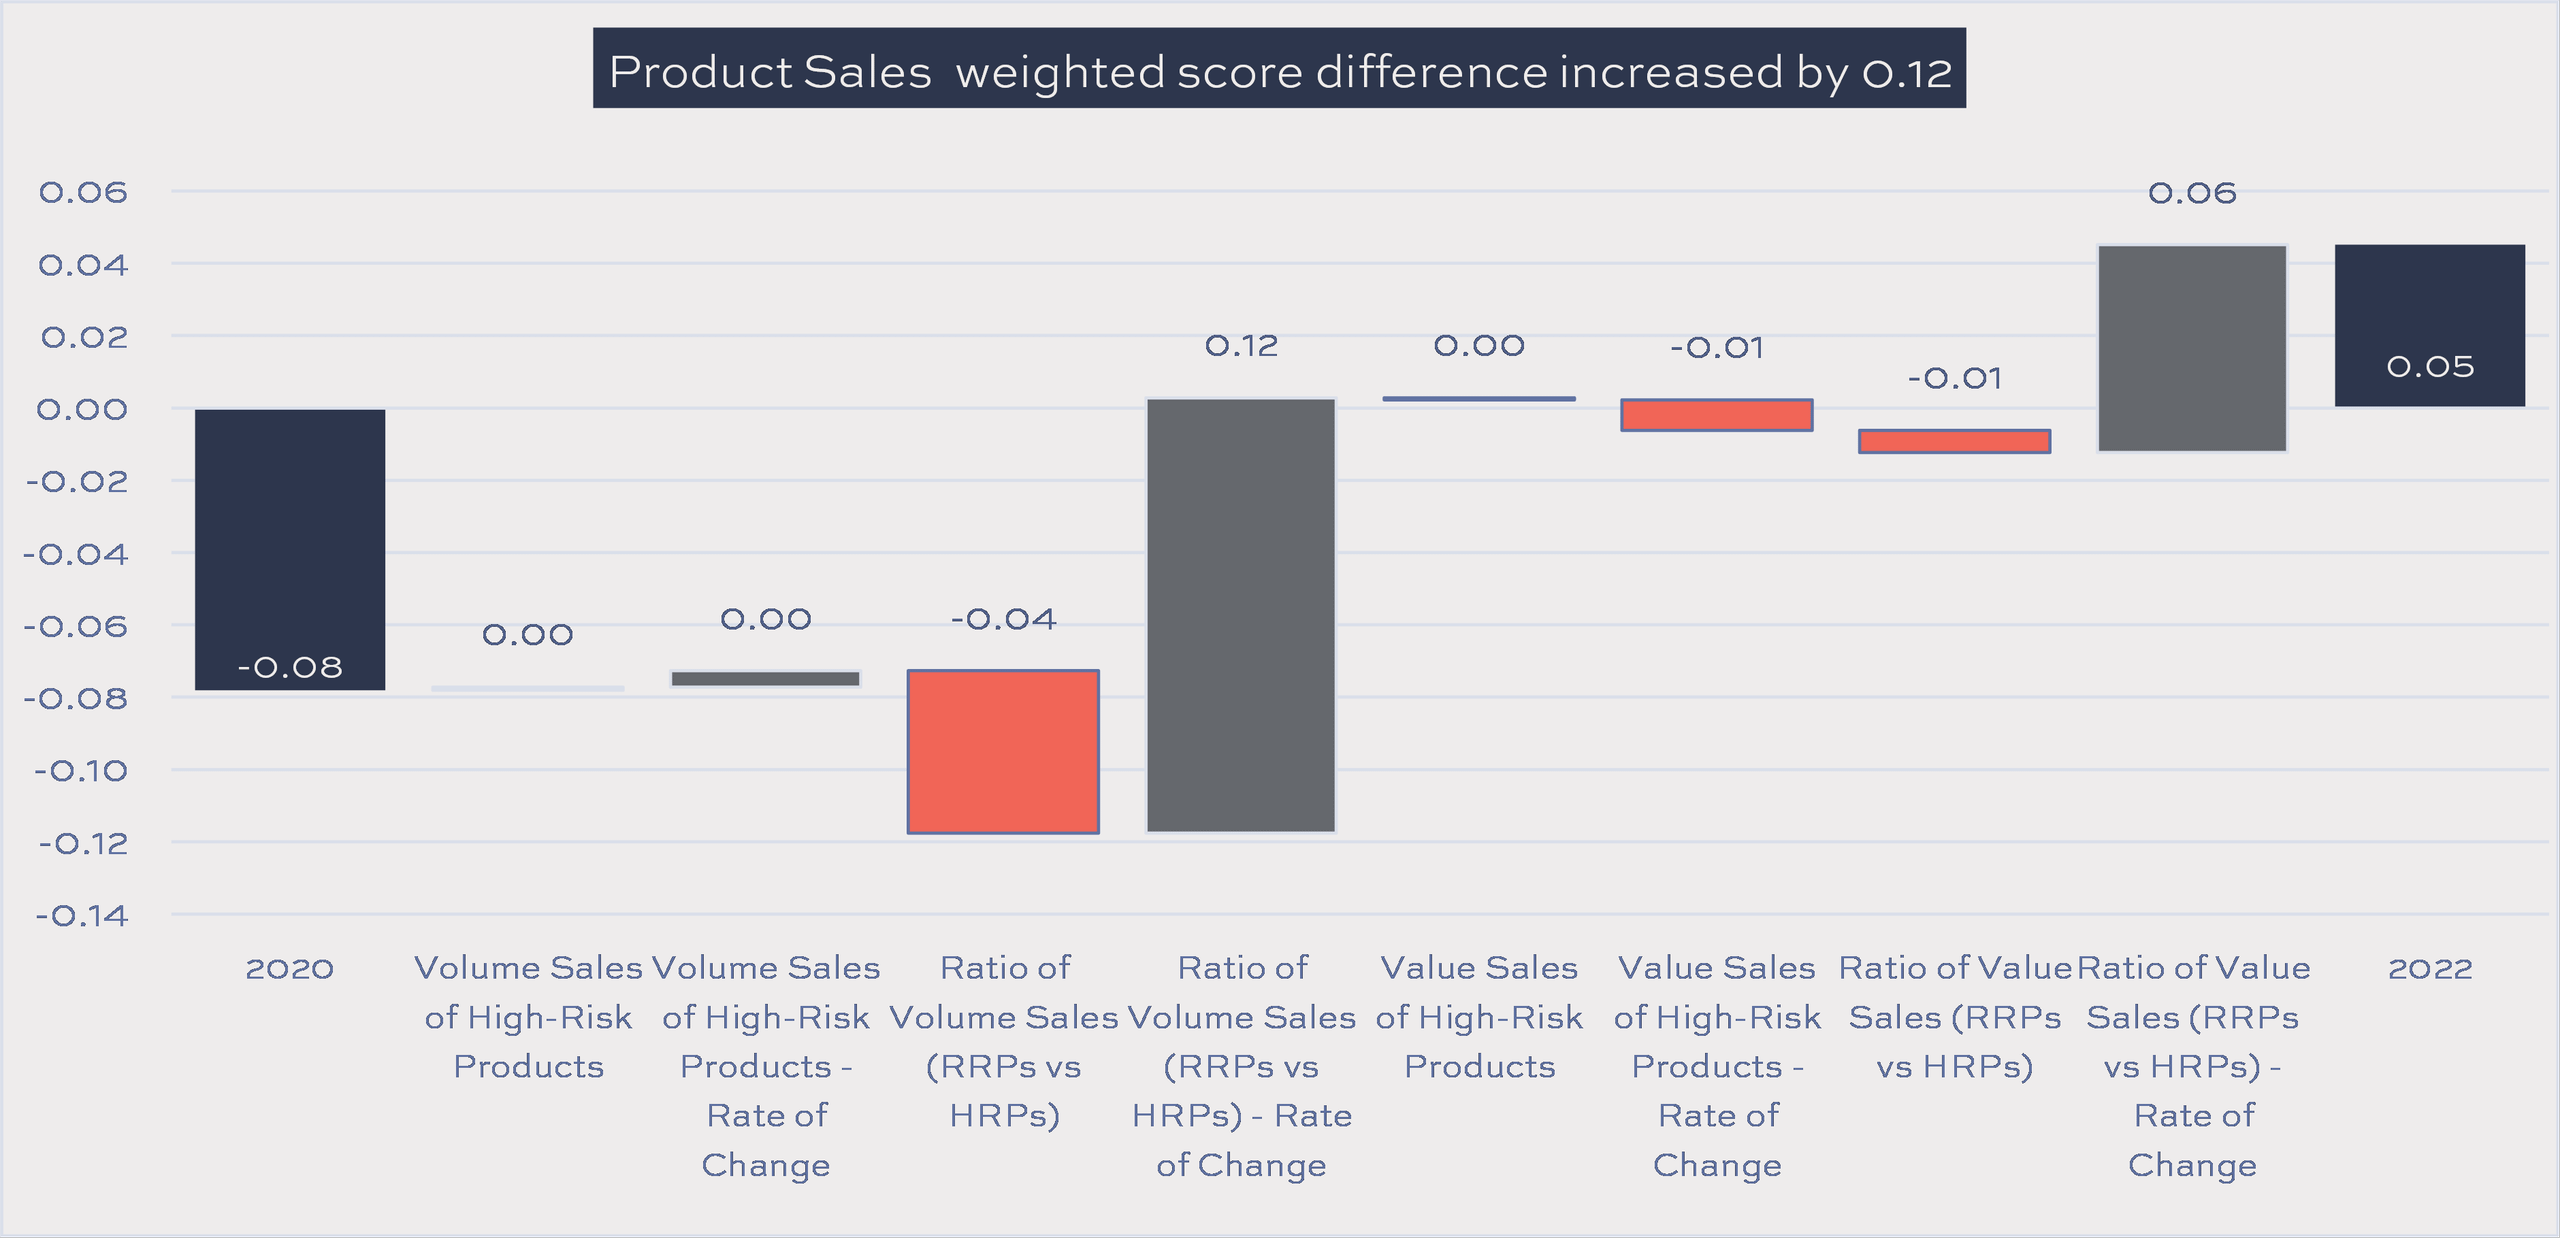 Source: Tobacco Transformation Index, Idwala Research

The Top Seven Comparison Excel Tool compares the contributions to Final scores, Category scores, rankings, score and ranking changes of the top seven Index companies as well as sales and capital allocation metrics as disclosed in the Accompanying Data file published with the Index. The charts below represent a small sample of what is available.


